Figures & data
Table 1. Comparison of the number of search results between news websites (accessed March 9, 2018. Similarly hereinafter for all searched datasets).
Figure 1. Research technical route.
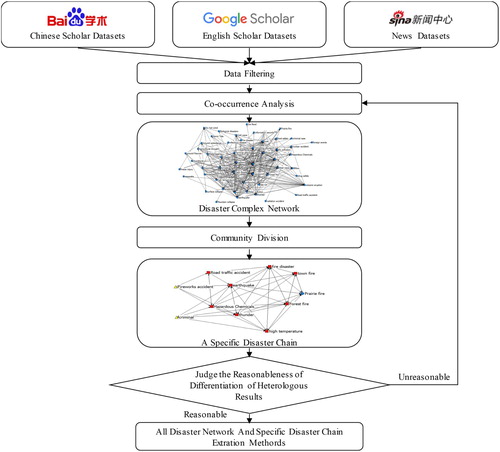
Table 2. Some of the search results through Baidu Scholar.
Table 3. Partial disaster co-occurrence frequency matrix obtained using Google Scholar.
Table 4. Jaccard index-based disaster co-occurrence frequency matrix (partly).
Figure 2. The constructed complex network graph of 73 disaster types.
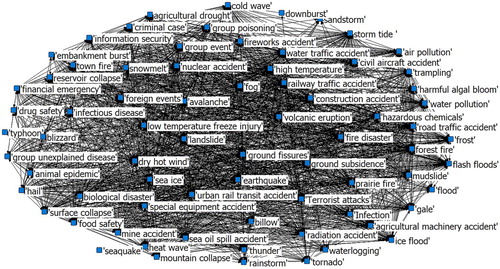
Figure 3. The optimized complex network graph with threshold value 0.03.
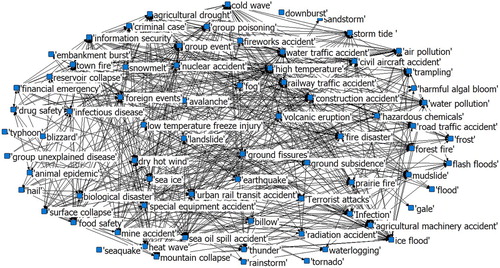
Figure 4. The structures of communities: (a) disjoint communities and (b) overlapping communities.
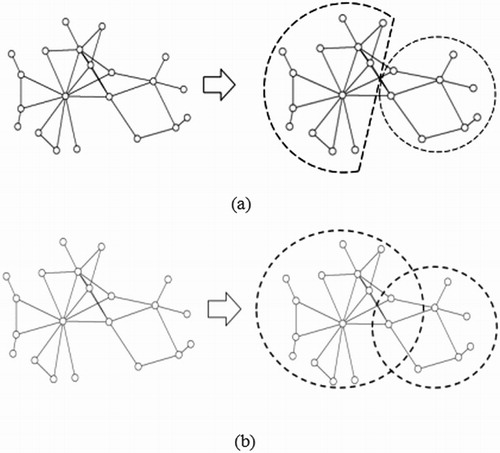
Figure 5. The flow of communities.
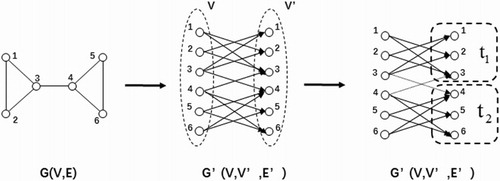
Figure 6. The extracted disaster chains of ‘flood’ from the complex network with three different threshold settings: (a) threshold is 0.001; (b) threshold is 0.01and (c) threshold is 0.03.
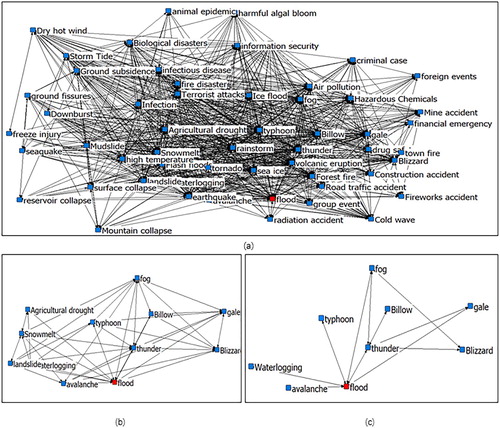
Figure 7. The relationship between the number of disaster chain nodes and the setting of threshold (a) ‘flood’ disaster chain based on Baidu scholar data and (b) ‘typhoon’ disaster chain based on Baidu scholar data.
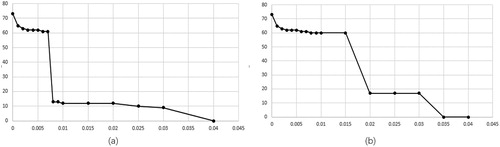
Figure 8. Comparison between Google Scholar data and Baidu Scholar data.
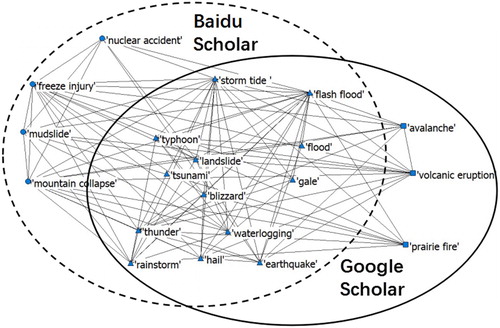
Figure 9. Comparison between Baidu Scholar data and Sina News data.
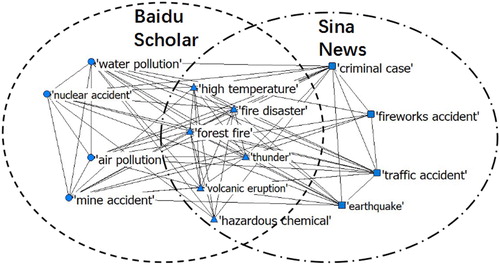
Figure 10. Comprehensive comparison of typhoon disaster chains.
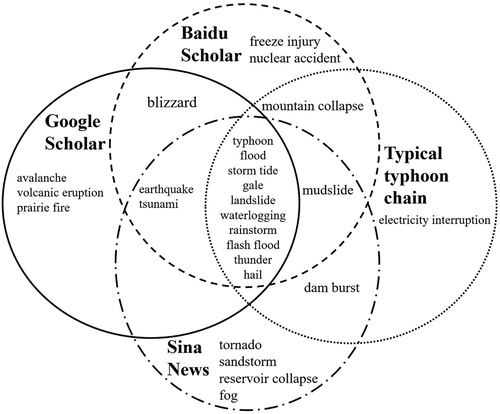
Figure 11. Comprehensive comparison of earthquake disaster chains.
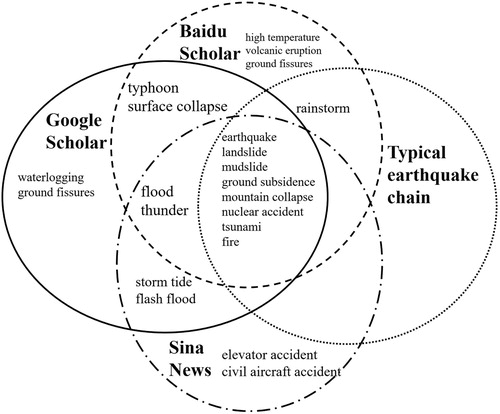
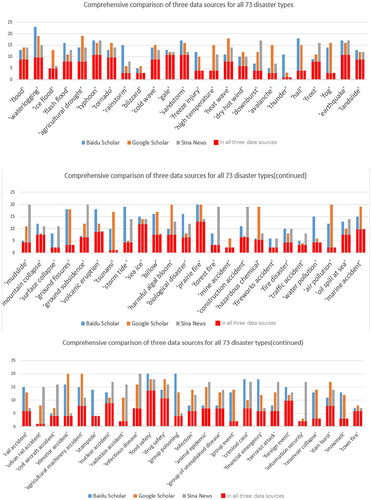
Figure 12. Comprehensive comparison of three data sources for all 73 disaster types; for each disaster type, the first column shows the result from Baidu Scholar, the second one from Google Scholar and the third one from Sina News; the vertical axis indicates the number of nodes in disaster chains.