Figures & data
Figure 1. The proposed framework of power outage classification and location detection.
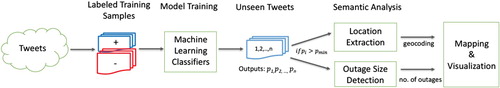
Table 1. Positive and negative power outage tweet examples.
Table 2. Comparison of machine learning classifiers on power outage tweet classification.
Figure 2. Top positive and negative features for power outage classification using the SVC and bag-of-ngram model.
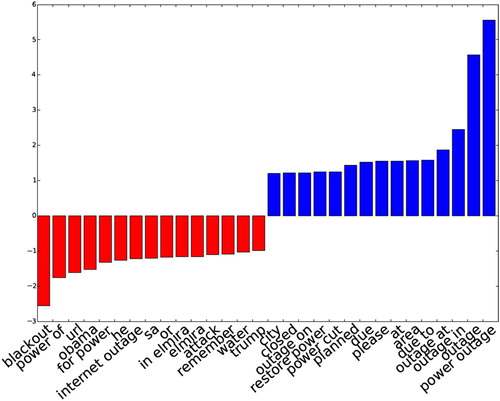
Figure 3. Daily power outage tweet volume (6 September to 8 October 2016).
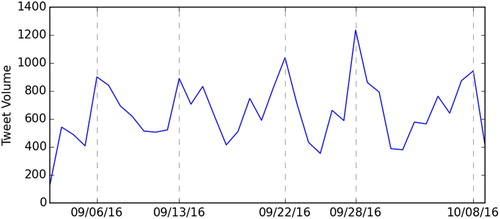
Figure 4. The network architecture of bi-LSTM-CRF for location detection.
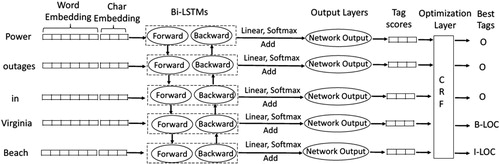
Table 3. Example of sentence encoded with BIO tagging scheme.
Table 4. Model comparisons: location detection results on the ALTA 2014 datasets.
Table 5. Datasets used for training, validating, and testing the location detection model.
Table 6. Location detection using the bidirectional LSTM-CRF model with different training datasets.
Table 7. Number of geotagged and geodetected tweets among 40,316 power outage tweets with  .
.
Table 8. Examples of locations detected from tweets by using bidirectional LSTM-CRF.
Figure 5. Maps of selected power outage tweets across the United States ().
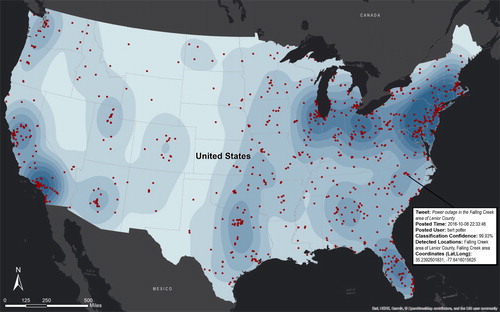
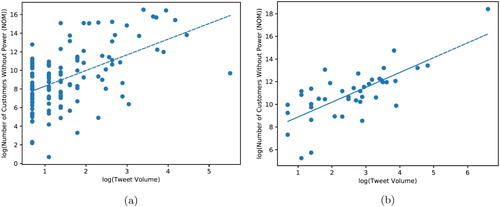
Figure 6. Scatter plot of power outage tweets versus number of customers without power, as reported by National Outage Map, for the period during which Matthew Hurricane affected Florida (6–7 October 2016) at both the US county and state levels. (a) County-level. (b) State-level.