Figures & data
Figure 1. Schematic illustration of the data integration concept used in this work.
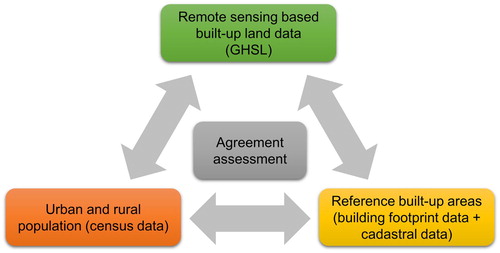
Table 1. Overview of the datasets and their characteristics used in this study.
Figure 2. Datasets used in this study shown for Northampton (Massachusetts), USA: (a) Parcel data including built-year information, (b) building footprint data, (c) rasterized reference built-up presence-absence surface in 2015, GHSL built-up areas (d) GHS_LDSMT_2015, (e) GHS_LDSMT_2017, (f) GHS_S1, (g) reference built-up density surface in 2015, (h) derived development intensity strata with white pixels indicating unreliable reference data, (i) per-pixel built-up proportions derived from the reference data in 2015, (j) urban census blocks, GHS_LDSMT_2015 250 m derived urban masks for a binarization threshold of (k) 1%, (l) 25%, (m) 50%, (n) agreement categories from overlaying GHS_LDSMT_2015 250 m 1% urban mask and urban census tracts, and (o) a high resolution aerial image (Source: ESRI) of the shown extent.
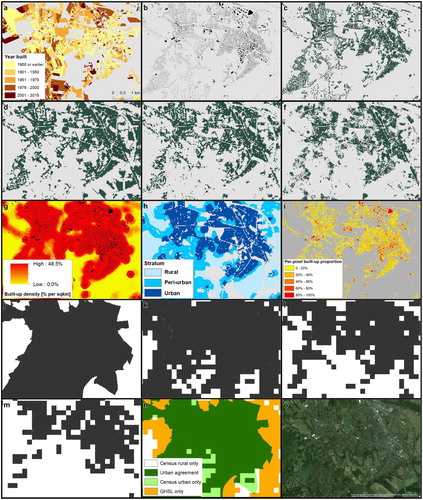
Figure 3. Workflow of the data processing and agreement assessments conducted in this work.
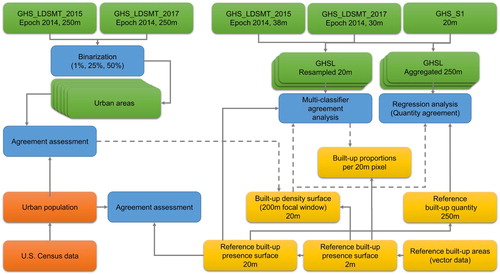
Figure 4. Results of the accuracy assessment of the three GHSL versions for rural, peri-urban, and urban strata across 31 counties. (a) Kappa index, (b) PCC, (c) User’s Accuracy, (d) Producer’s Accuracy, (e) F-measure, (f) G-mean, (g) quantity disagreement, and (h) allocation disagreement.
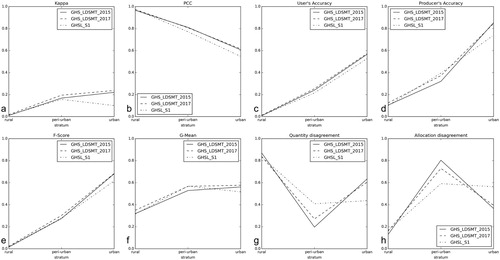
Figure 5. Agreement between the three GHSL versions in a random sample of 200,000 pixels across the 31 counties (a) sorted by agreement combination, and (b) sorted by built-up density.
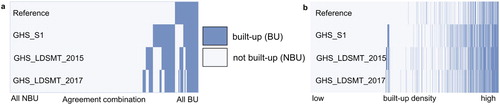
Figure 6. Distribution of built-up density by agreement combination for (a) all 31 counties, (b) New York City (urban), (c) Ramsey County (MN, peri-urban), and (d) Boulder County (CO, peri-urban / rural).
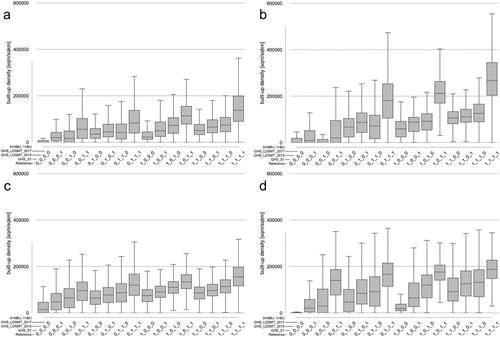
Figure 7. Distribution of reference built-up proportion per pixel for different agreement combinations (reference positives only) in (a) New York City, (b) in Ramsey County (MN), (c) in Boulder County (CO), and (d) over all 31 counties.
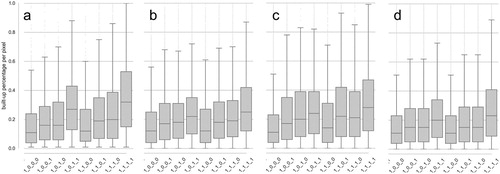
Figure 8. Results of the regression analysis predicting reference built-up quantity in blocks of 250 m across different strata of development intensity and over all strata (left to right) based on GHS_S1, GHS_LDSMT_2017, and GHS_LDSMT_2015 (thus sorted by increasing spatial resolution from top to bottom).
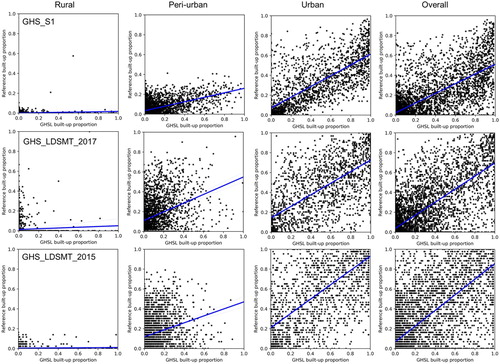
Table 2. Numerical regression results.
Figure 9: Agreement measures between urban areas derived from parcel and census data: (a) User’s Accuracy, (b) Producer’s accuracy, and (c) F-Measure.
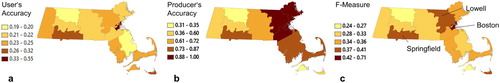
Figure 10. Agreement categories for urban census blocks and GHS_LDSMT_2015 using binarization thresholds of (a) 1%, (b) 25%, (c) 50% and (d-f) for GHS_LDSMT_2017, respectively.
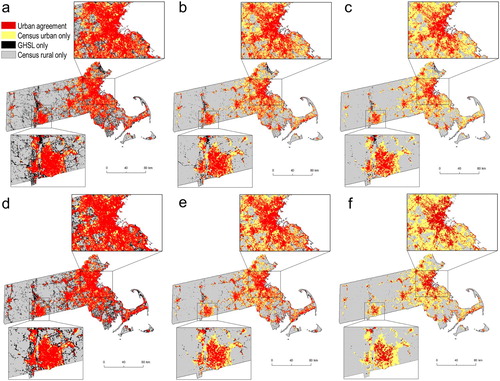
Table 3. Area and allocated population values in the agreement categories for the overlay of census and GHSL-derived urban areas.
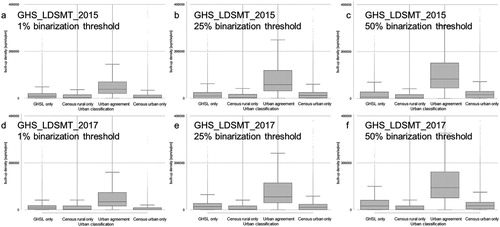
Figure 11. Distribution of built-up density for categories of agreement between census-derived urban population and built-up land derived from GHS_LDSMT_2015 (top row) and GHS_LDSMT_2017 (bottom row) based on binarization thresholds of 1%, 25%, and 50% (from left to right).