Figures & data
Figure 1. Comparison of the products approximating human settlement and built-up surfaces (a), and the resultant settlement masks (b).
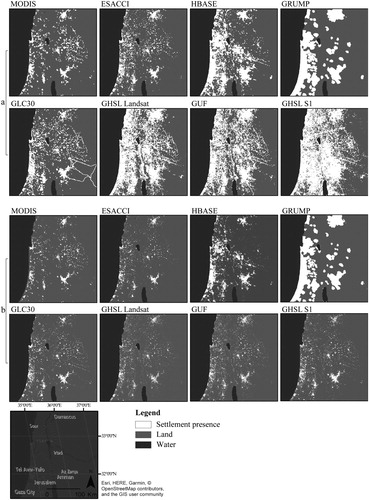
Table 1. Main characteristics of products used in the analysis.
Figure 2. Examples of agreement map centred on areas nearby: Amsterdam (Netherlands) (a), Cairo (Egypt) (b), and Tel Aviv (Israel) (c); Mwanza (Tanzania) (d), Doha (Qatar) (e), and Seoul (South Korea) (f); New Orleans (USA) (g) and Cuenca (Ecuador) (h).
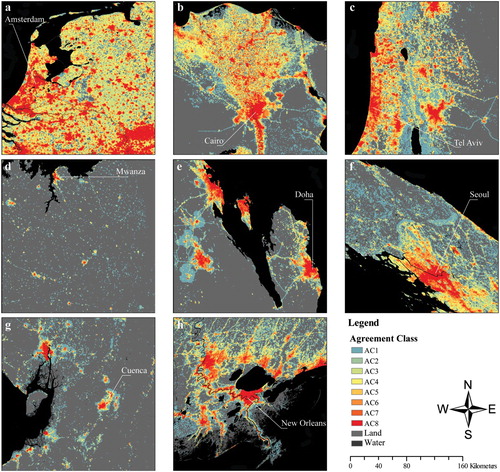
Figure 3. Overview of the Generalised Settlement Area map.
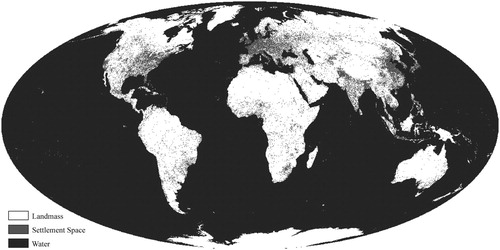
Table 2. Global assessment of water, landmass and settlement space.
Figure 4. Overview of the share of the agreement class within the Generalised Settlement Area map (a), and the share of the water accounted in each agreement class.
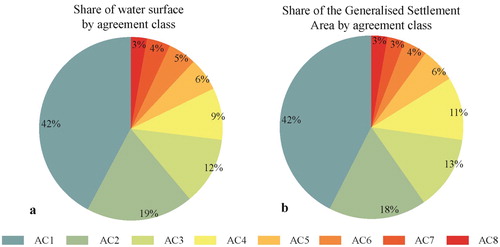
Table 3. Settlement mask (SttlMsk) general statistics (AC1 – Agreement Class 1).
Figure 5. Overview of the share of agreement class in each settlement mask.
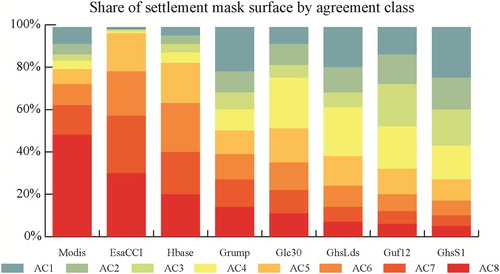
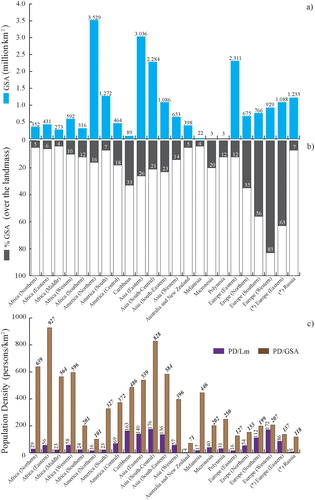
Figure 6. Overview of the regional analysis. Total area of the Generalised Settlement Area (GSA) per UN Region in km2 (a), the share of the agreement class within each region (b), and the absolute surface of each settlement masks per region (c).
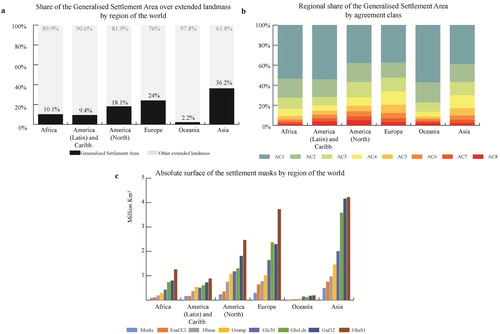
Figure 7. Refined regional analysis of the Generalised Settlement Area (GSA) map: the total surface of the GSA per region in km2 (a); the share of the GSA within surface of each region (b); and the average population density per region (PD/Lm) and GSA (PD/GSA) surfaces depicted in violet and brown colour, respectively (c). An additional division of the Easter Europe region has been made (marked by (*) symbol) to identify the Russia contribution.