Figures & data
Figure 1. Study areas in Kenya.
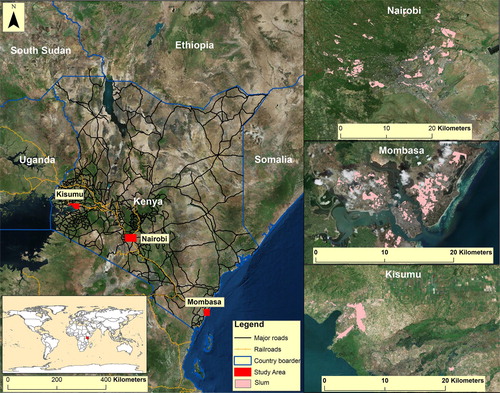
Figure 2. Methodology workflow.
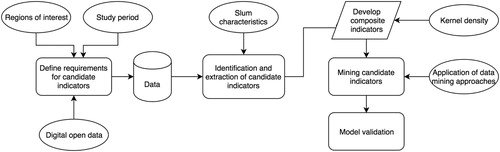
Table 1. Candidate indicators for slums.
Figure 3. Distribution of positive classified cases for slums for (a) logistic regression, (b) discriminant analysis and (c) the See5 decision tree.
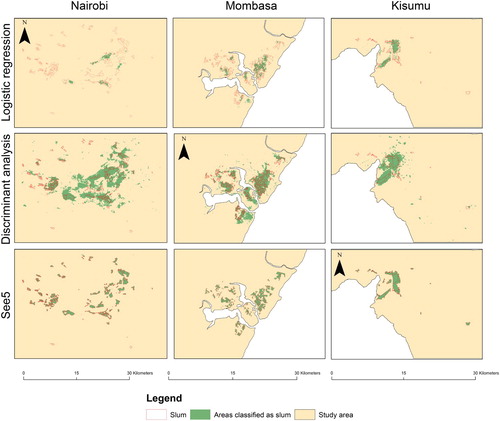
Table 2. Distribution of slums cases.
Table 3. Overall classification accuracies.
Table 4. Indicators for first four levels for See5 tree for each study site.
Figure 4. Urban and slum areas in Nairobi (False composite image created by stacking image bands 7, 6 and 4 from the Landsat 8 satellite. Pink to white tones highlight urban areas).
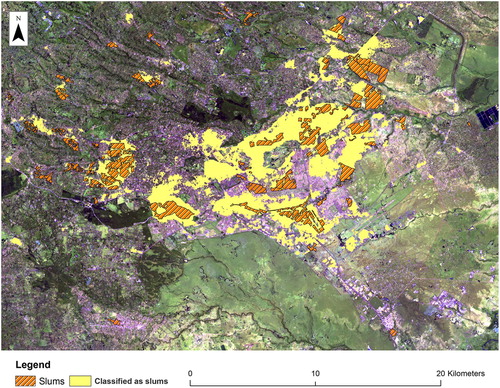
Table 5. Percent change in accuracy using the remote sensing data as the baseline.
Figure 5. See5 tree up to 4th level for (a) Nairobi, (b) Mombasa and (c) Kisumu.
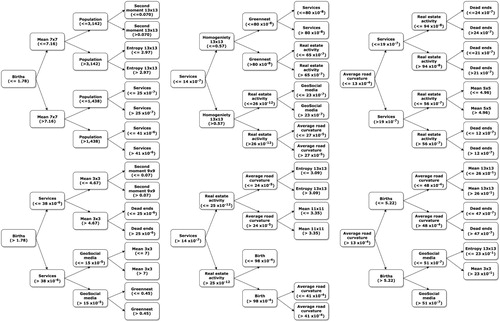
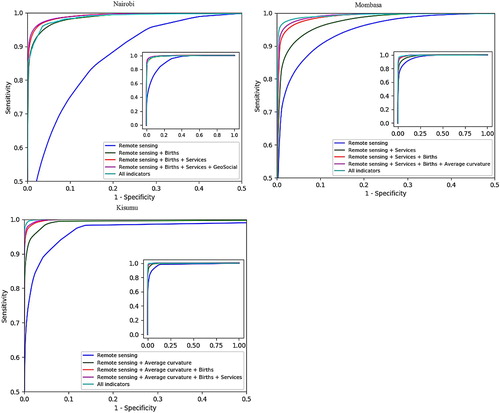
Figure 6. ROC curves for See5 trees built with the remote sensing indicators, the progressive addition of the most significant socio-economic indicators to the remote sensing indicators, and using all indicators for all three study sites. The inset image in each figure shows the full distribution of the data.