Figures & data
Figure 1. Number of publications per year retrieved from the Institute of Science Information Web of Science for crowdsourcing (query = ‘crowdsourcing’ or ‘crowdsourced’), satellite image analysis (query = ‘satellite image analysis’), and satellite image analysis using crowdsourcing (query = ‘crowdsourcing’ and ‘satellite image analysis’) during the period from 2006 to 2016. Numbers beside the bars represent the number of articles for publications that focus on satellite image analysis using crowdsourcing.
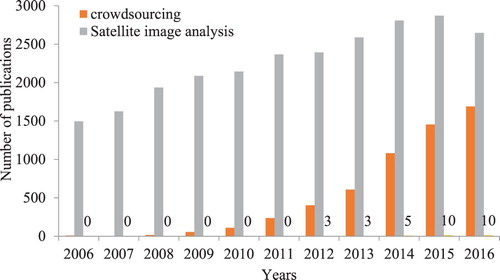
Figure 2. A visualization of the global land cover types using the GlobCover product provided by the Geo-Wiki.org Web site.
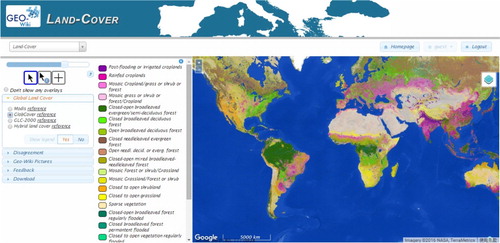
Figure 3. Schemas for the (a) parallel and (b) iterative models for organizing crowdsourcing strategies. Source: Maisonneuve and Chopard (Citation2012).
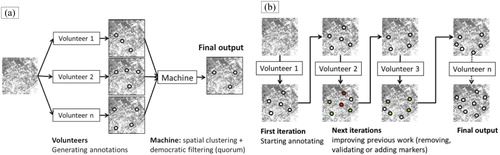
Figure 4. (Top) Images of three areas with different topologies and densities of buildings. (Bottom) Expert classification of buildings from these images. Source: Maisonneuve and Chopard (Citation2012).
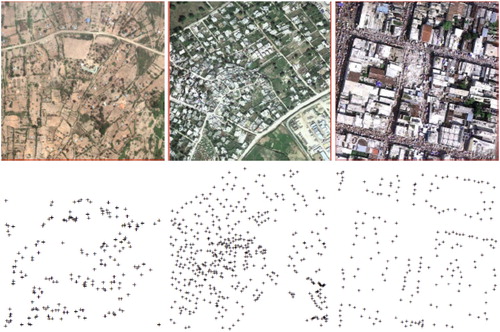
Figure 5. Platform of OSM (a), Wikimapia (b) and field papers (c,d).
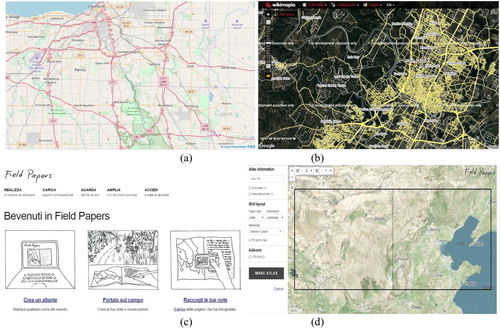
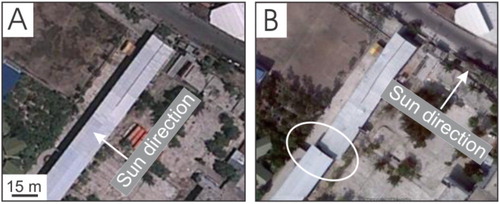
Figure 6. Use of time proxies for the cognitive task analysis method in structural building damage assessment before (A) and after (B) disaster. ©Google Earth. Source: Kerle and Hoffman (Citation2013).