Figures & data
Figure 1. Location map and satellite image of Johannesburg, South Africa. (Source: Google Map. Note: Not drawn to scale, for representative purpose only.)
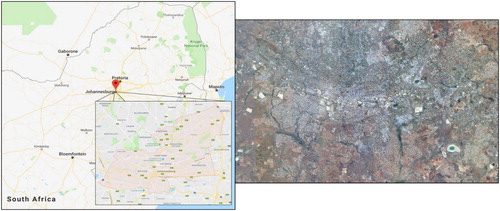
Figure 2. Location and satellite image of Sana’a, Yemen. (Source: Google Map. Note: Not drawn to scale, for representative purpose only.)
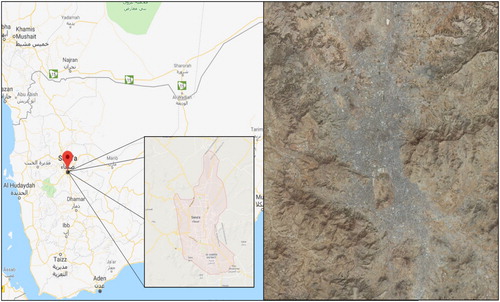
Figure 3. Location and satellite image of Ndola, Zambia. (Source: Google Map. Note: Not drawn to scale, for representative purpose only.)
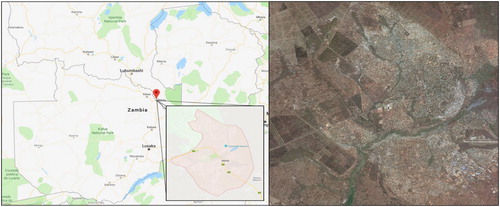
Figure 4. Samples showing different settlement types identified in three cities.
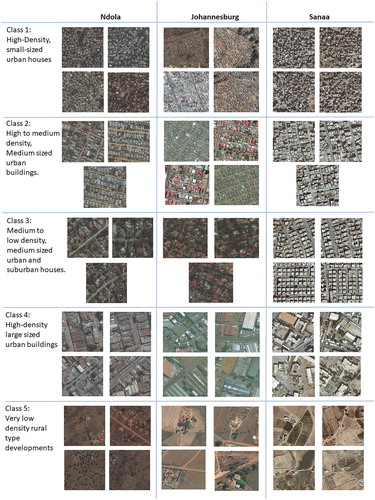
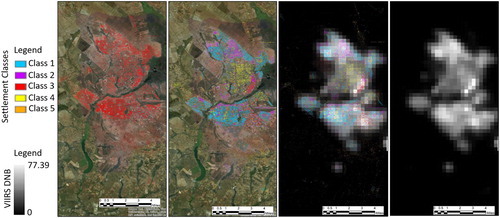
Figure 5. Clockwise from top-left: Settlement Map, Settlement Classes, Settlement Classes overlaid on VIIRS DNB image, and VIIRS DNB data for Johannesburg, South Africa.
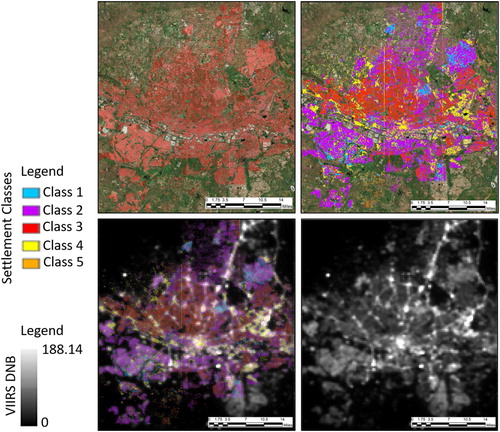
Figure 6. From left: Settlement Map, Settlement Classes, Settlement Classes overlaid on VIIRS DNB image, and VIIRS DNB data for Sana’a, Yemen.
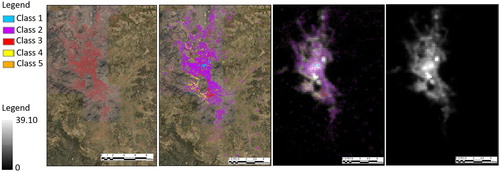
Figure 7. From left: Settlement Map, Settlement Classes, Settlement Classes overlaid on VIIRS DNB image, and VIIRS DNB data for Ndola, Zambia.