Figures & data
Figure 1. Elevation and distribution of topographic regions across the southern Appalachian Mountains.
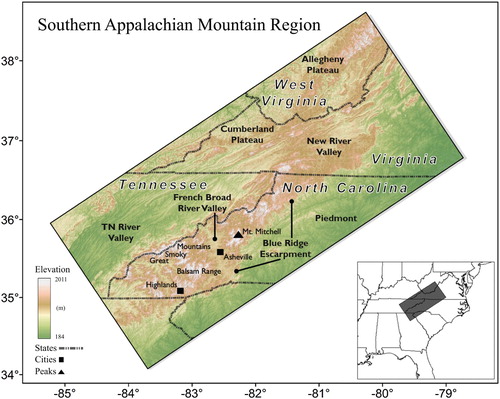
Figure 2. Google Earth scene across a topographic transect from Asheville, NC, in the valley bottom, to Mt. Mitchell, across the ridgeline in the background. Photographic imagery Copyright 2016. Image: Landsat. Data: SIO, NOAA, U.S. Navy, NGA, GEBCO.
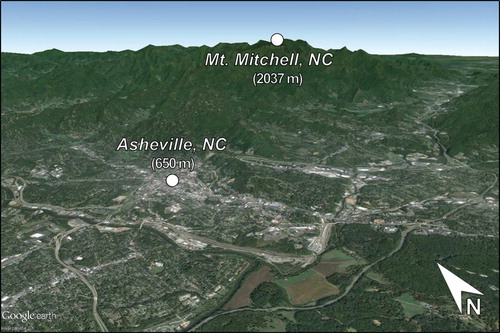
Figure 3. (a) Average summer precipitation derived from daily, gridded PRISM precipitation estimates. (b) Average daily intensity of precipitation is calculated using all non-zero precipitation days. (c) Average summer maximum precipitation. (d) Frequency of days per season with precipitation in each grid cell.
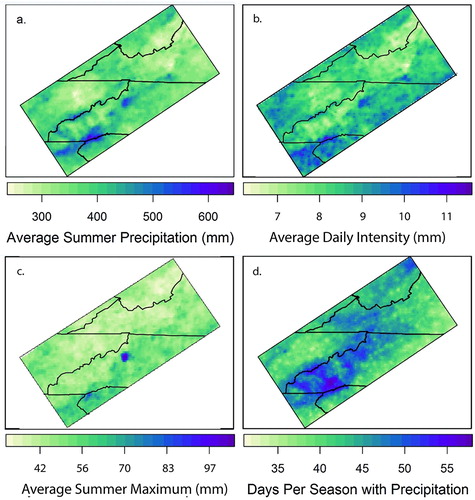
Figure 4. Comparison of the average number of days per season with (a) very light, (b) light, (c) moderate, and (d) heavy precipitation events.
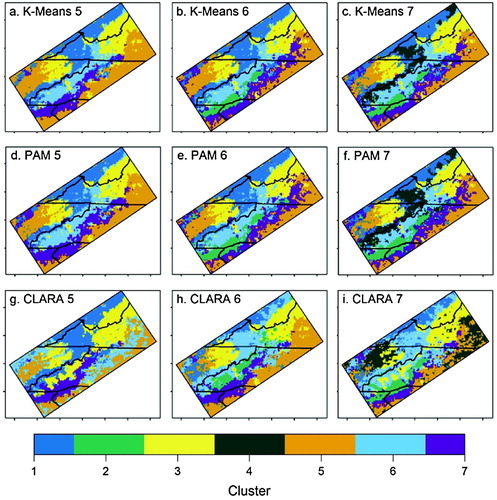
Figure 5. Visualization depicting the average number of days per season with (a) very light, (b) light, (c) moderate, and (d) heavy precipitation events across the topographic transect. Photographic imagery Copyright 2016. Image: Landsat. Data: SIO, NOAA, U.S. Navy, NGA, GEBCO.
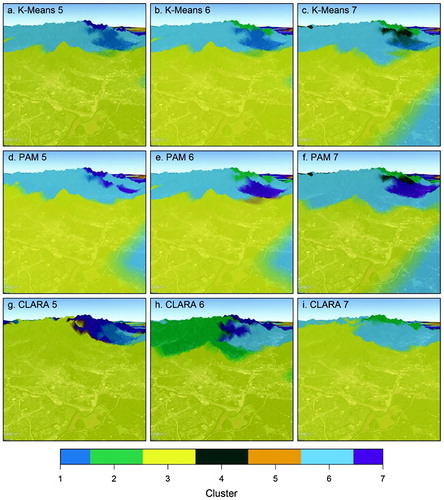
Figure 6. Performance comparison of clustering results with five (left column), six (center column), and seven (right column) clusters. Clustering results from K-means (upper row), PAM (center row), and CLARA (lower row) clustering algorithms are compared. A single legend is used for all combinations; however, certain cluster numbers (e.g. 3, 5) will not be used in each column.
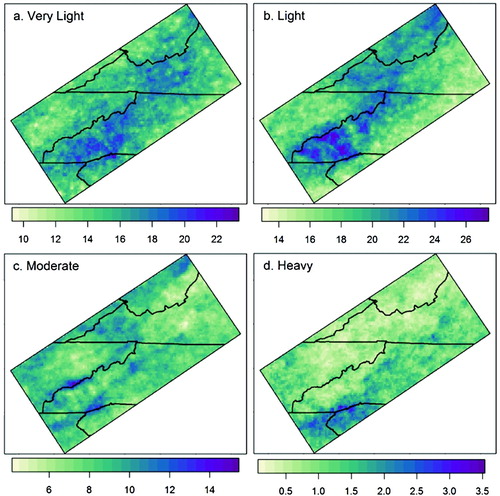
Table 1. Internal validation statistics comparing five, six, and seven clusters for K-Means, PAM, and CLARA clustering algorithms.
Figure 7. Visualizations of the nine clustering results are subjectively compared across the transect. The visualization allows the user to pan, zoom, and tilt across different topographic regions of the SAM. Photographic imagery Copyright 2016. Image: Landsat. Data: SIO, NOAA, U.S. Navy, NGA, GEBCO.
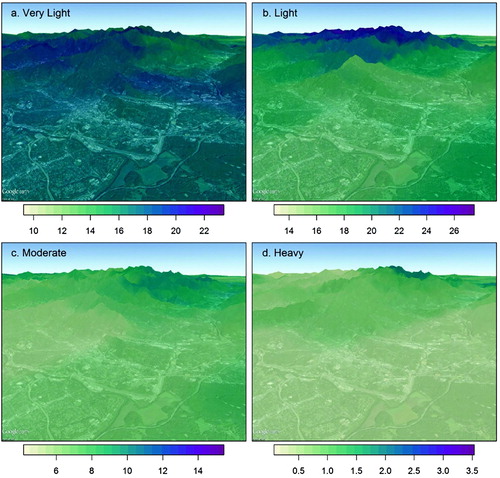
Figure 8. PAM 5 clustering results with 5 clusters or hydroclimatic regions and their elevation descriptive statistics.
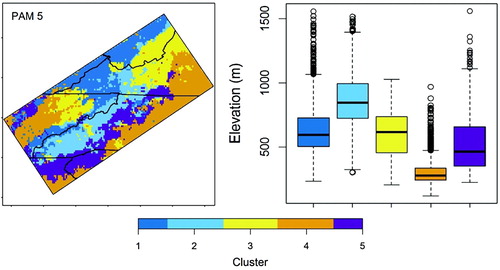
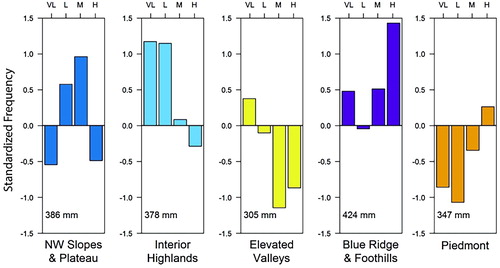
Figure 9. Composite bar plots are used to determine the precipitation characteristics for each hydroclimatic region. Average standardized frequencies for very light (VL), light (L), moderate (M), and heavy (H) precipitation are computed to reveal cross-regional differences in hydroclimatic character.