Figures & data
Figure 1. Intersections between different sets of EVs. (Modified diagram initially from: GEOWOW-WP6-IOU-16.1.1).
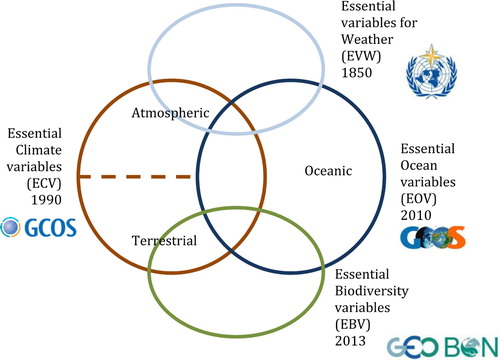
Figure 2. Essential variables are defined in a way that relevance (or impact), feasibility and cost-efficiency are maximized. (a) Specific ECVs example from Bojinski et al. Citation2014. (b) General example from Bombelli et al. Citation2016.
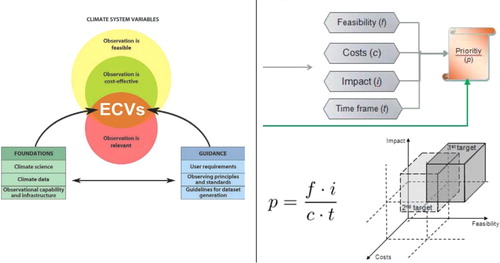
Figure 3. Classification of indicators in the DPSIR framework (modified version from in Mace and Baillie Citation2007).
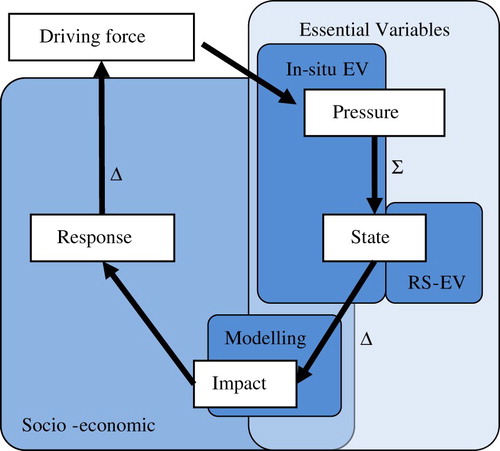
Figure 4. Essential variables in the context of the information needed to obtain measurable indicator values (modified version from Pereira et al. Citation2013 Fig. S1).
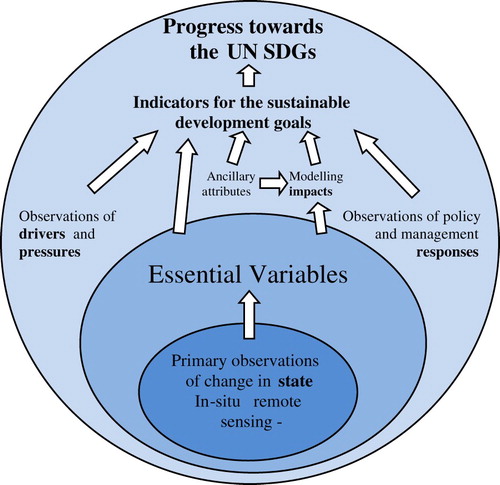
Figure 5. Original graph diagram of networks done by the ENEON Observatory.
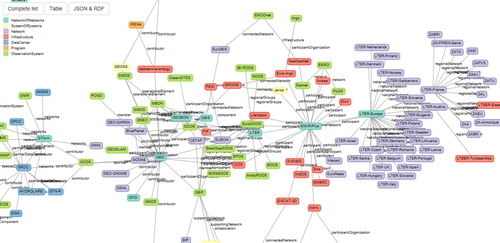
Figure 6. UML model for the graph.
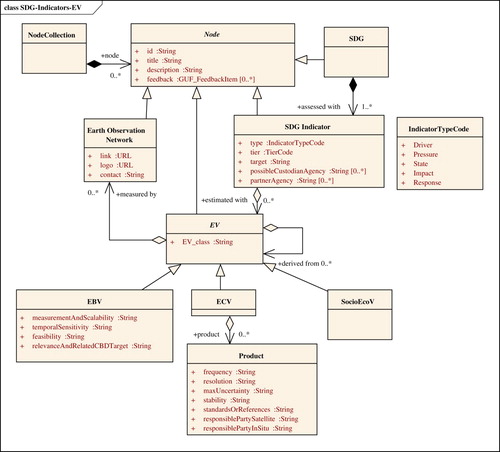
Figure 7. The graph that links SDGs, indicators (classified following the DPSIR framework), EVs and EO networks.
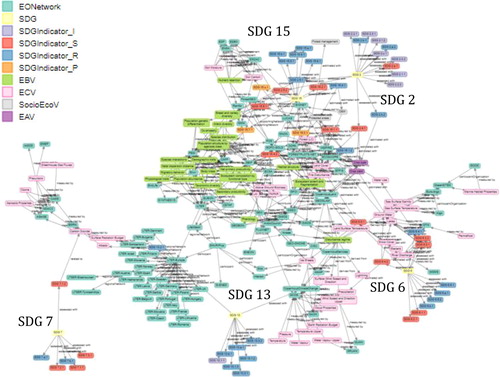
Figure 8. Connection of the graph to the NiMMbus user feedback system.
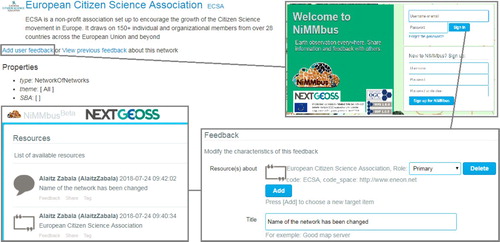
Table 1. SDG indicators classification following the DPSIR framework done in this study.
Figure 9. SDG15 indicators classified as pressures (in red), status (in orange) and responses (in blue).
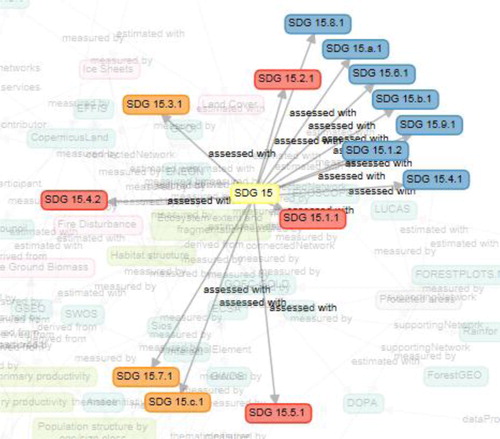
Figure 10. SDG 15.1.1 and its relation to forest area and land cover.
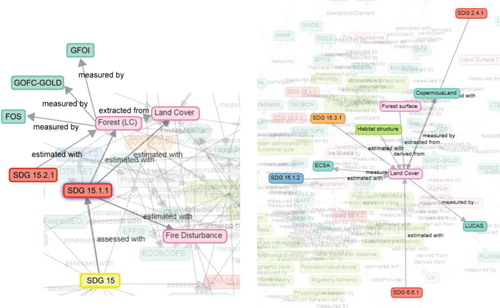
Table 2. EBV and its connection with SDG15 indicators.
Figure 11. In some cases, there is a need for introducing some socioeconomic variables (in grey) as a filter, such as protected areas or DEM.
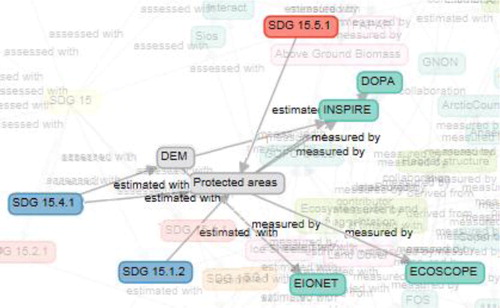
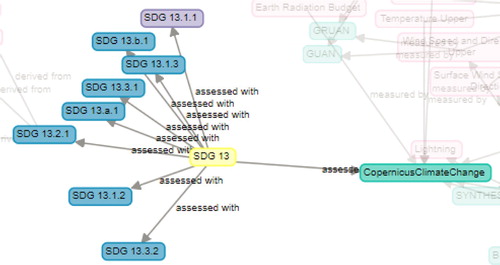
Figure 12. Direct relation from an EONetwork to a SDG goal as an exception for the SDG 13 goal.