Figures & data
Figure 1. Study area and ground observation locations.
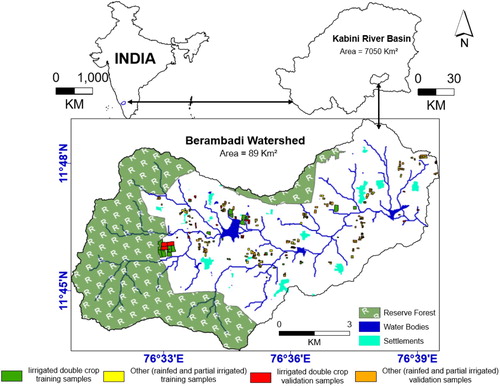
Table 1. Characteristics and dates of acquired Radarsat-2 satellite images.
Figure 2. Daily rainfall of the Berambadi watershed for Radarsat-2 pass duration.
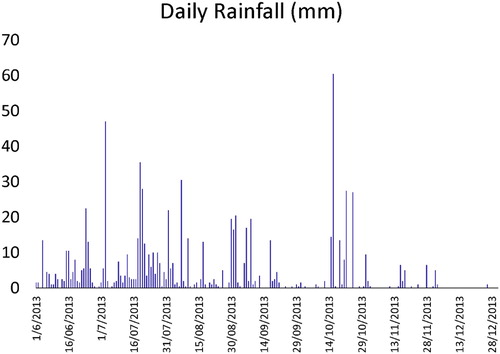
Figure 3. Image processing workflow.
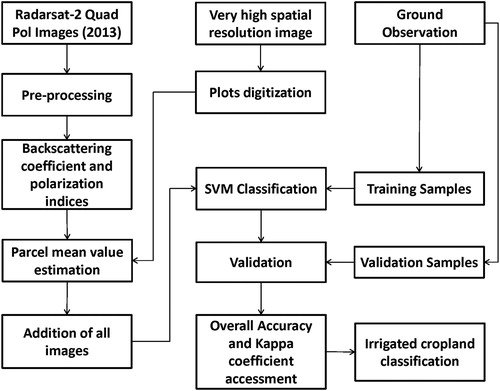
Table 2. The table presents confusion matrix, user's accuracy, producer's accuracy, overall classification accuracy (OA), and the kappa coefficient for all SVM classified outputs from various polarization indices. Where a and b represent respectively irrigated double-croplands (irrigated in Kharif and Rabi cropping seasons) and other (partial groundwater irrigation during or rainfed) croplands.
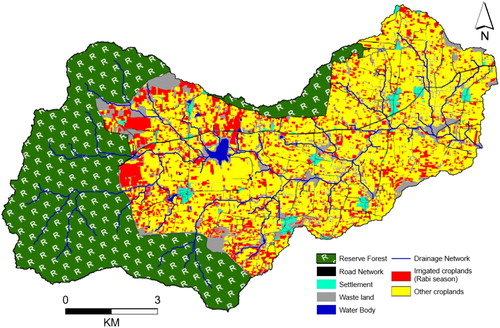
Figure 4. Spatial distribution of dual-irrigation in the Berambadi watershed in 2013. The other croplands are partially groundwater irrigated in the absence of rainfall or grown under only rainfed condition.
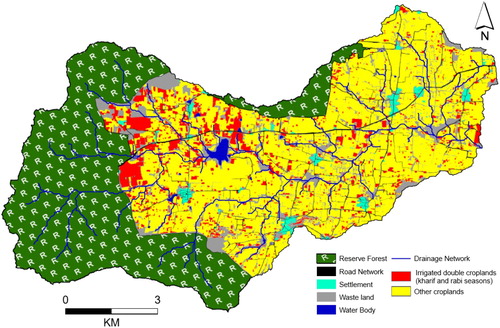
Table 3. Total irrigated area and classification accuracy for the dual-irrigation practices in the Berambadi watershed. Where a and b are representing respectively irrigated croplands and other (rainfed and fallow) croplands.
Figure 5. Spatial distribution of Kharif cropping season irrigated croplands. The other croplands are partially groundwater irrigated in the absence of rainfall or grown under only rainfed condition.
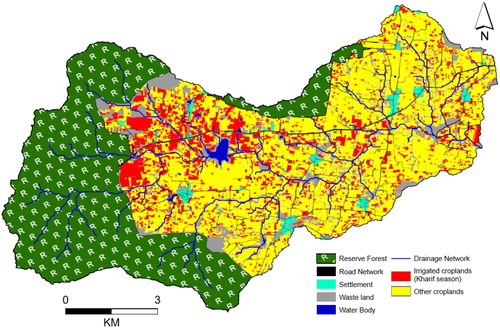
Table 4. Total irrigated area and classification accuracy for the Kharif cropping season. Where a and b are representing respectively irrigated croplands and other (rainfed and fallow) croplands.
Figure 6. Spatial distribution of Rabi cropping season irrigated croplands. The other croplands are partially groundwater irrigated in the absence of rainfall or grown under only rainfed condition.