Figures & data
Figure 1. Workflow for calculating Sustainable Development Goals indicators 15.1.1, 15.3.1 and 2.4.1.
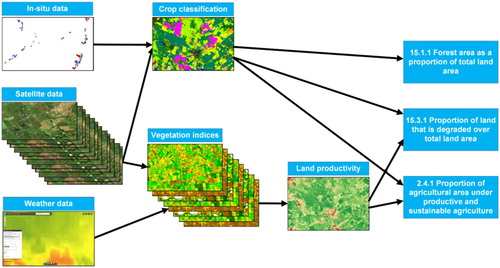
Figure 2. Food, water, energy Essential Variables that are used in SDG indicator 15.1.1, 15.3.1, 2.4.1 workflows.
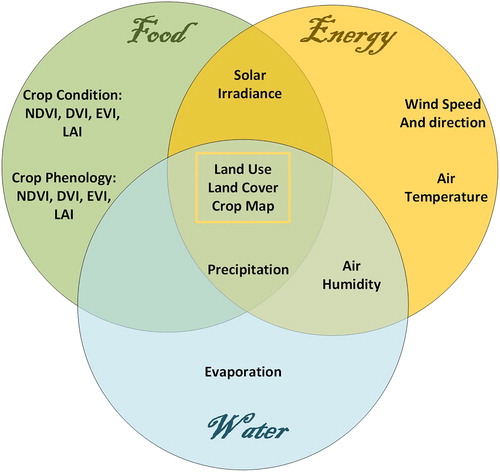
Figure 3. Crop classification map at 10 m spatial resolution for Ukraine for 2017.
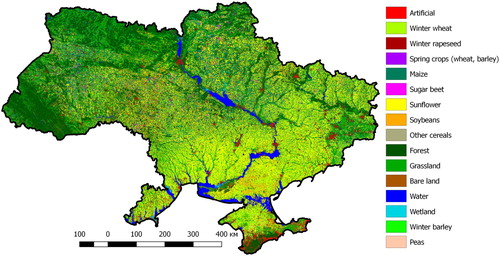
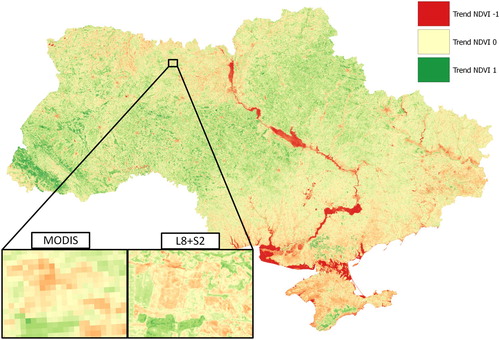
Figure 4. Visual comparison of the (a) 300m landcover ESA CCI-LC and with the (b) 10m crop classification map for Kiev.
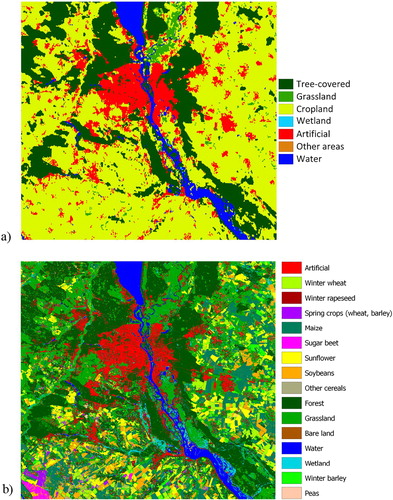
Figure 5. Workflow for indicator 2.4.1 implementation in VLab.
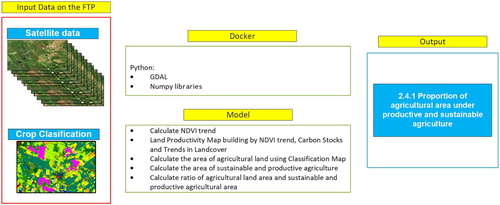
Figure 6. Workflow for indicator 15.3.1 realisation in VLab.
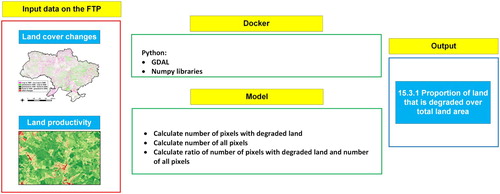
Figure 7. Examples of VIs (NDVI and DVI) fitting versus accumulated GDD for a winter wheat field in 2017.
Figure 8. Relationship between accumulated NDVI and DVI against winter wheat yields for 2016 and 2017.
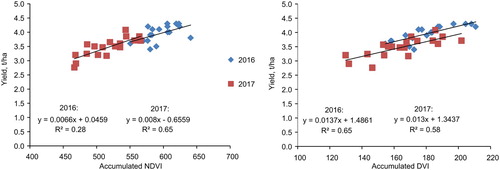
Table 1. Forest area as a proportion of total land area by statistics and our classification maps in 2000, 2010 and 2016 years.
Figure 9. Comparison coarse resolution productivity map based on MODIS data and our high-resolution productivity map for Ukraine territory for the year 2017.