Figures & data
Table 1. List of ongoing satellite products on atmospheric pollution available for the Kyiv region.
Figure 1. Continuous recording of PM2.5 and PM10 measurements along streets: (a) intersections with heavy traffic streets in Kyiv (30 June 2017); (b) central part of the city and traffic jam at the Ring road (1 July 2017).
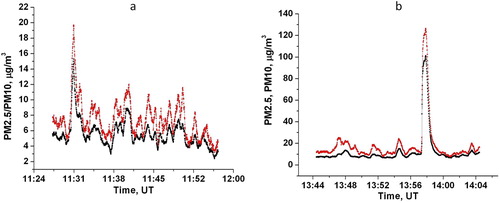
Figure 2. Kyiv NO2 concentrations based on Copernicus data and CGO measurements.
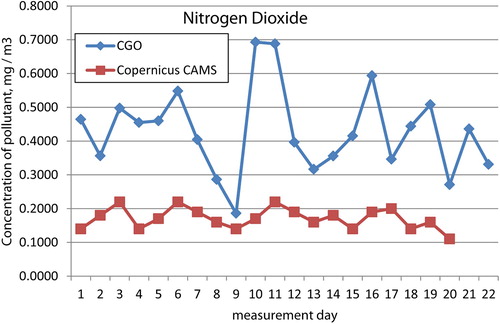
Figure 3. Kyiv SO2 concentrations based on Copernicus data and CGO measurements.
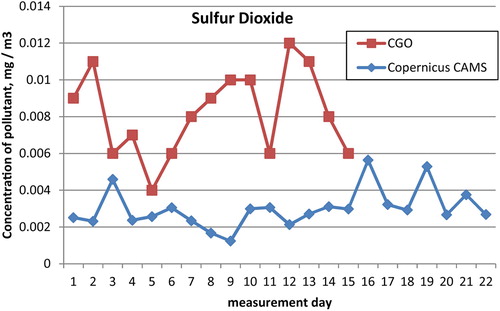
Figure 4. Comparison of the PM10 (a) and PM2.5 (b) concentrations to daily AOD (500 nm) Level 1.5 measured at Kyiv AERONET site during June–October 2017.
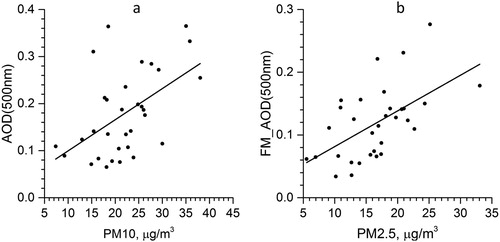
Figure 5. The spatial distribution of PM2.5 concentration in μg/m3 (color scale below) in (a) January, (b) March, (c) July and (d) November 2016.
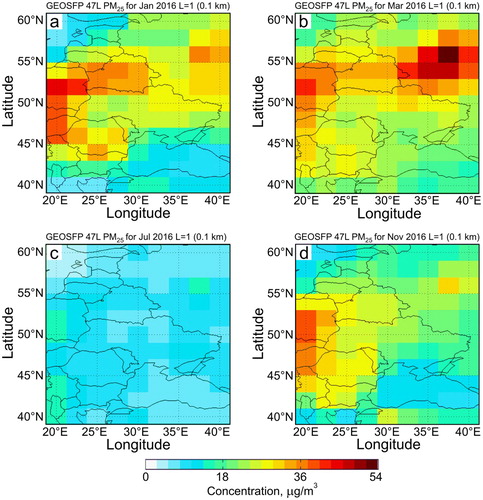
Table 2. Measurement data and limit values РМ10/РМ2.5.
Table 3. Air quality index.
Figure 6. Dynamic light-scattering histograms of water-suspended wood smoke aerosol preparations. Distribution of particle populations by intensity (a) and volume (b). Measurement was made during 1 min, sequentially marked in the histogram as lines 1–4.
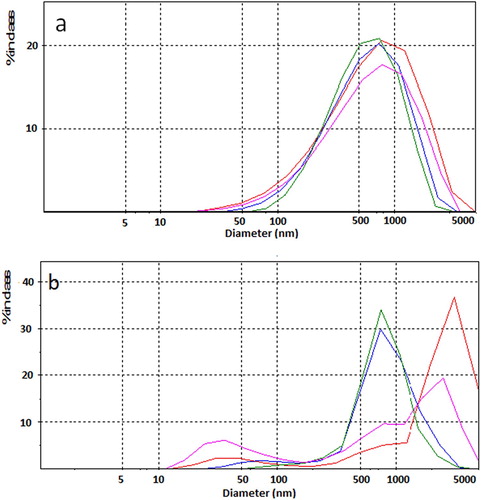
Figure 7. Structural diagram for the proposed AQI measurement device.
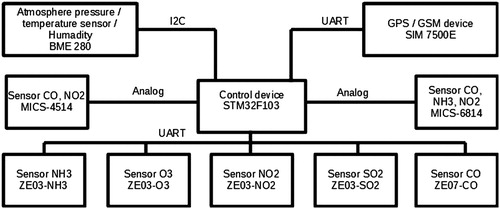
Figure 8. The MICS-4514 sensor’s temperature dependencies of the normalized electrical conductivity at CO concentrations in the air, ‰: 1–10; 2–50; 3–80.
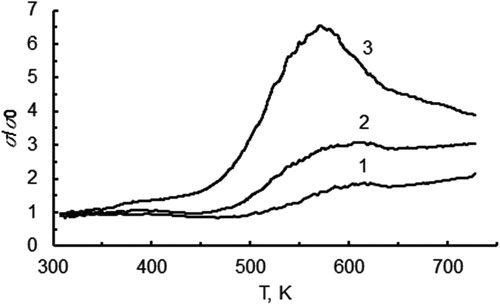
Figure 9. Change density PM2.5 during a few days in May of year 2018.
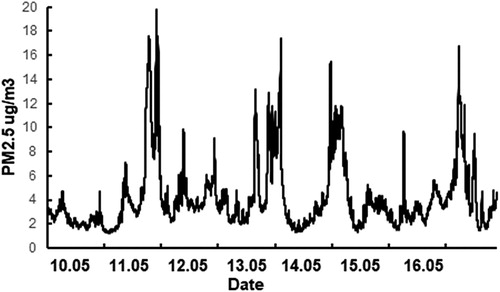
Figure 10. Kyiv Air Quality System and connections with the GEOSS platform and ERA-PLANET projects.
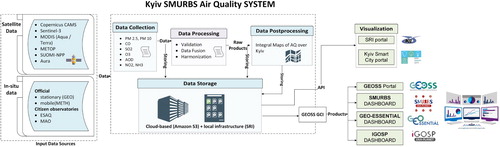
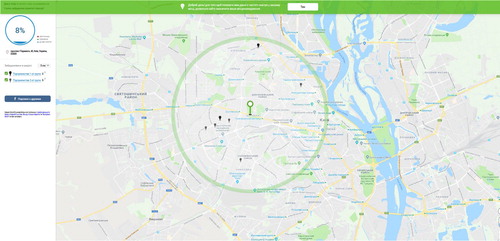
Figure 11. Air Quality Indicator – https://breezometer.com.
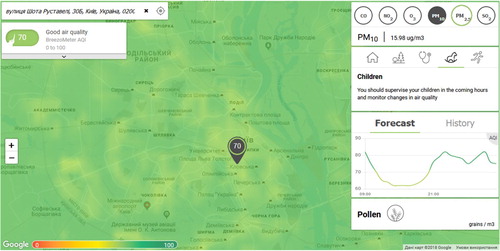
Figure 12. Database of ecological monitoring for the Kyiv region.
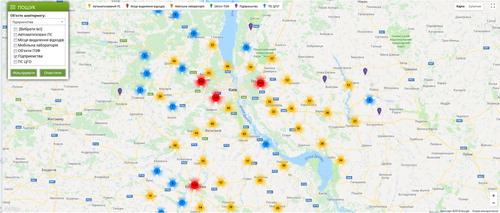
Figure 13. ECOINFO portal, point level air quality estimates.