Figures & data
Figure 1. Schematic of the data flow and processes required to generate ECVs from FCDRs and TCDRs, and their applications, based on Dowell et al. (Citation2013).
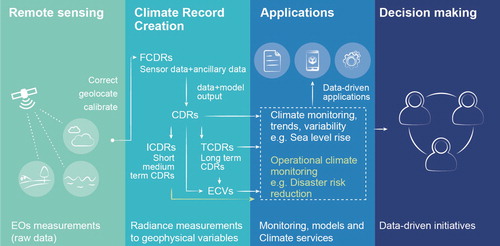
Table 1. Summary of identified coordination initiatives, catalogues and projects publishing ECV data products.
Figure 2. List of initiatives that provide access to ECVs data products (CDRs) with significant contributions from satellites. Based on datasets available at GOSIC Data Access Matrix (GOSIC Citation2015), GCOS requirements for ECVs (GCOS Citation2016b), CEOS Database (CEOS and ESA Citation2015), WGClimate ECV Inventory Access (WGClimate 2018), ESA CCI (ESA Citation2015), QA4ECV portal (Scanlon and Nightingale Citation2017), CM SAF portal from the ‘European Organisation for the Exploitation of Meteorological Satellites’ (EUMETSAT Citation2018) and Obs4MIPs data catalogue (ESGF Citation2018).
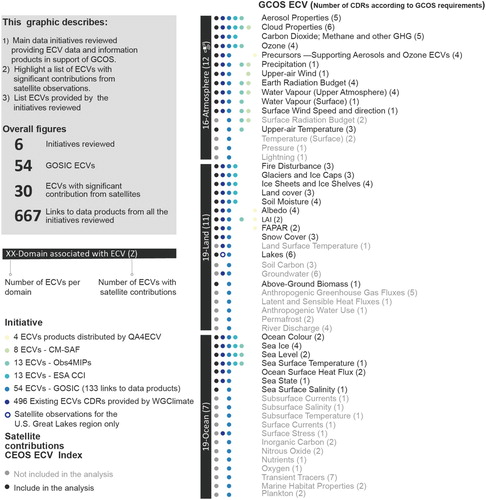
Table 2. Overview of maturity assessments related to CDR or ECV initiatives found in the literature.
Table 3. ECV data discovery and access revision matrix.
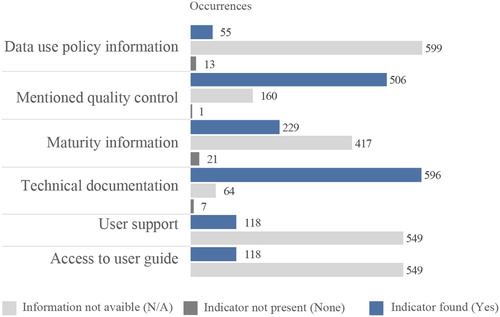
Figure 3. Classification of the 667 assessed data records, for each accessibility indicator. Numbers indicate the number of data records in each category.
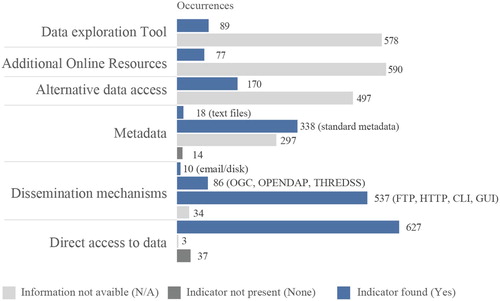
Figure 4. Summary of the usability indicators (occurrence of values). A total of 667 data records were assessed.