Figures & data
Figure 1. Conceptual workflow.
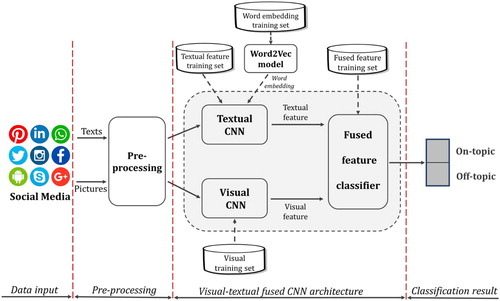
Figure 2. Transfer learned model from Inception-v3; the original Inception-v3 architecture graph (Main body) is adopted from Serengil (Citation2018).
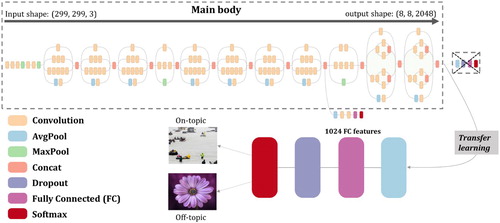
Table 1. Layer functionality summary.
Figure 3. Word embedded CNN architecture.
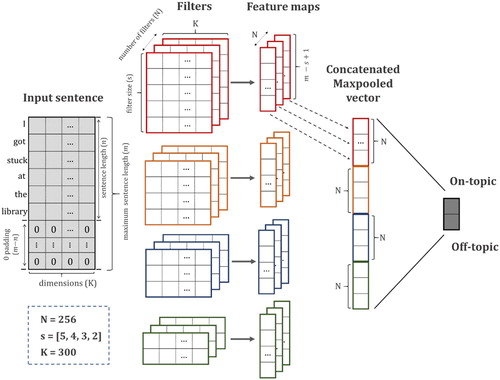
Figure 4. Fusion of visual and textual information.
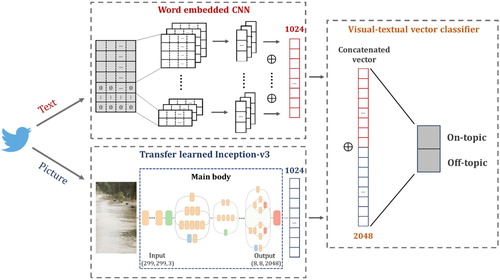
Figure 5. Research area for two flooding cases with their geotagged tweets; (a) Continental U.S; (b) South Carolina flood in 2015 with 934,896 geotagged tweets from October 2 to October 9; (c) Houston flood in 2017 with 501,516 geotagged tweets from August 25 to September 1.
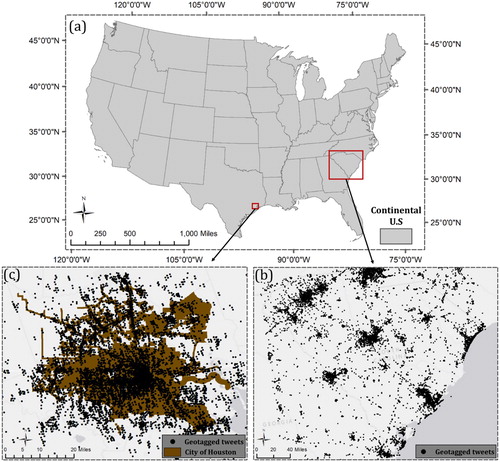
Table 2. Visual training set.
Table 3. Textual training set.
Figure 6. Model performance of the visual CNN: (a) the ROC curves for all 5 folds; (b) the training and validation accuracy curves for fold 3 (best fold) in two stages.
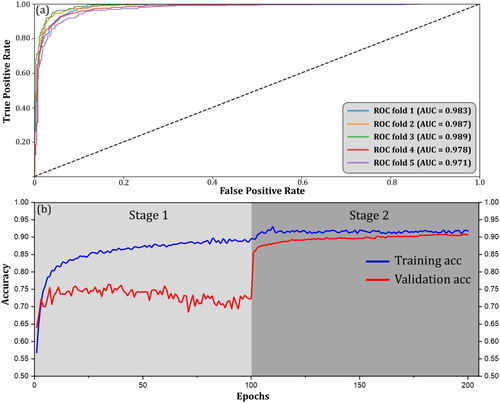
Table 4. Visual CNN performance.
Table 5. Word2Vec training results (top 5 neighboring words with their cosine-similarity distances).
Figure 7. (a) Textual CNN ROC curve for all 5 folds; (b) Training accuracy curve for fold 1 during 200 epochs; (b) Training loss curve for fold 1 during 200 epochs.
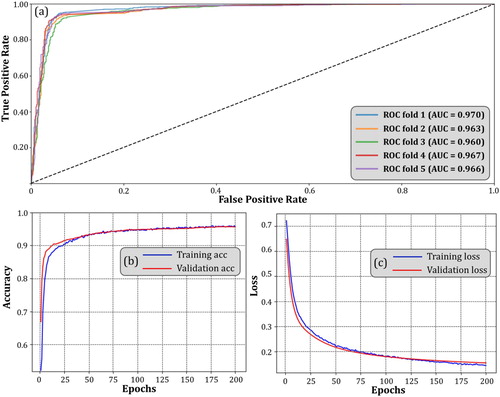
Table 6. Textual CNN performance.
Table 7. Visual-textual fused classification accuracy.
Table 8. Visual-textual fused classification compared with textual only.
Figure 8. ROC curves of the six algorithms using visual-textual fused vector () and using textual vector (
) alone; (a) LogR; (b) DT; (c) RF; (d) SVM (Linear); (e) SVM (RBF); (f) SVM (Sigmoid).
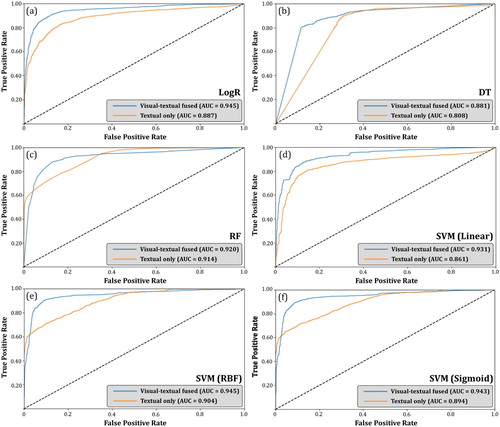
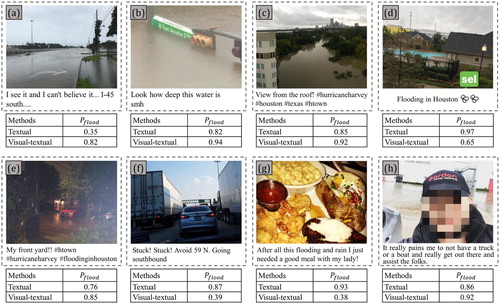
Figure 9. Eight Examples of classification results. denotes the probability of a post being flood relevant. Blurring was applied to faces appeared in the photo.