Figures & data
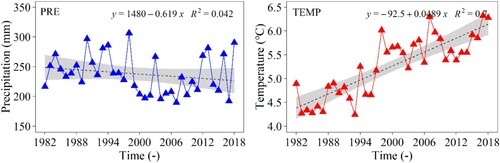
Figure 1. Topographical and land cover maps of the Mongolian Plateau.
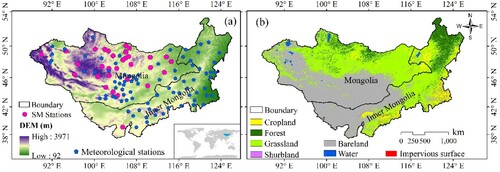
Figure 2. Frequency distributions of Bias (a), R (b), RMSE (c), and ubRMSE (d) between the four gridded datasets and in-situ soil moisture from 33 meteorological stations.
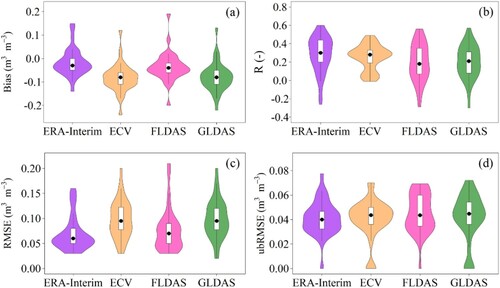
Figure 3. Relative uncertainty of the four gridded products during the period of 1982 − 2018 quantified by the TCH method.
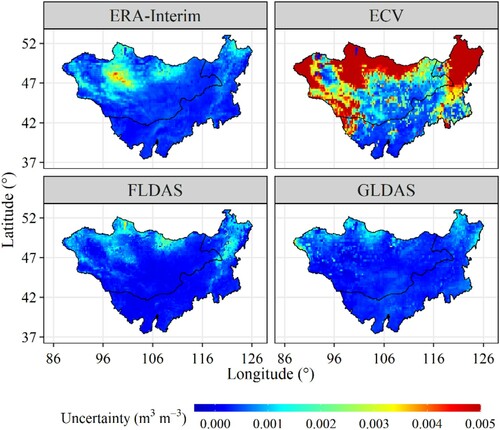
Figure 4. Temporal distribution of soil moisture during the period of 1982 − 2018 based on the four gridded products. (The boxplots display the median, inter-quantile range, upper, and lower quantiles of soil moisture. The white points present the mean values of soil moisture).
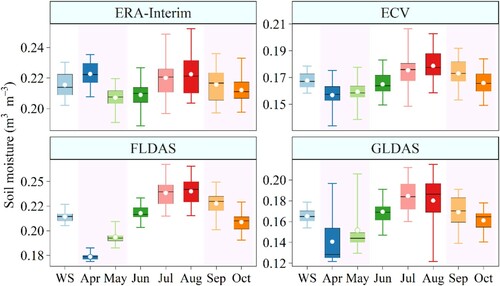
Figure 5. Average soil moisture in different land cover regions during the period of 1982 − 2018 based on the four gridded products.
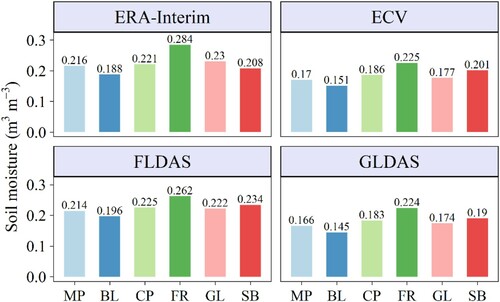
Figure 6. Spatial distribution of the average soil moisture in the Mongolian Plateau during the warm season of 1982 − 2018 based on the four gridded products.
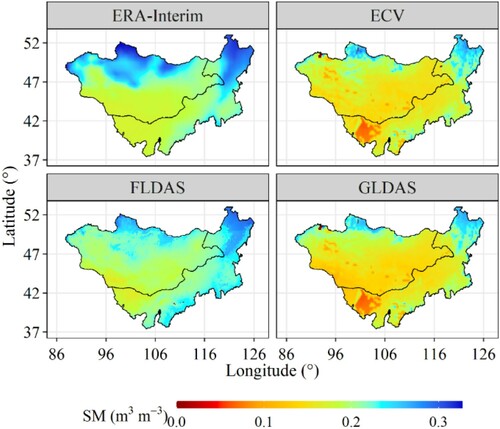
Figure 7. Variations of annual soil moisture during the period of 1982 − 2018 based on the four gridded products.
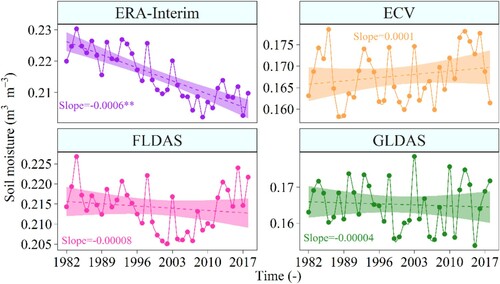
Table 1. Annual and seasonal change rates (m3·m−3/decade) of soil moisture during the period of 1982 − 2018 based on the four gridded products (* indicates p<0.05 and ** indicates p<0.01; the same below).
Figure 8. Percentage of study area showing different changing trends in soil moisture during the period of 1982 − 2018.
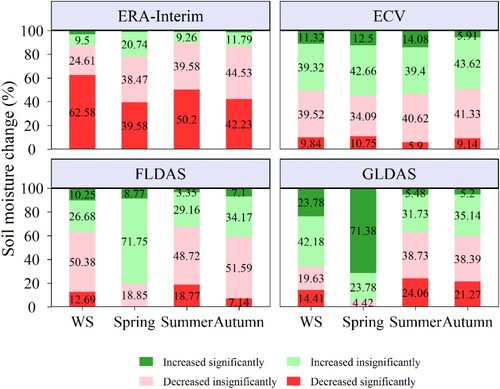
Figure 9. Spatiotemporal variations of soil moisture during the period of 1982 − 2018 based on the four gridded products.
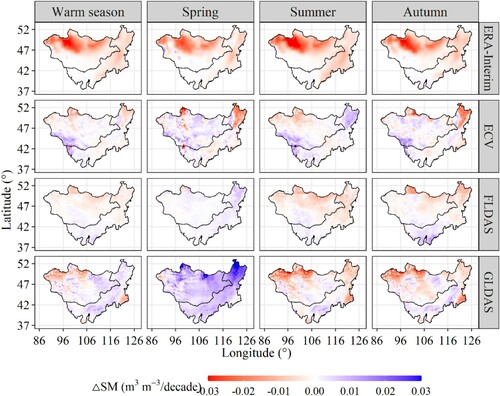
Figure 10. Percentage of different land covers showing different changing trends in soil moisture during the period of 1982 − 2018.
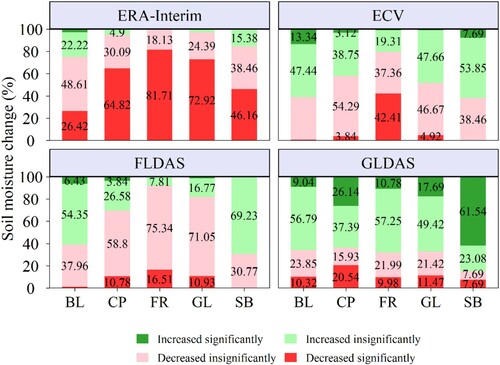
Table 2. Changing rates (m3·m−3/decade) of soil moisture in different land covers during the period of 1982 − 2018.
Figure 11. Variations of precipitation (PRE) and temperature (TEMP) in warm seasons during the period of 1982 − 2018 based on the CRU gridded product.