
Figures & data
Figure 1. Geographical situation and zonal landscapes of the Russian Far East (adapted from Isachenko Citation1985). Legend: I – state boundaries; II – regional boundaries; III – zonal landscape boundaries; IV – zonal landscape numbers. Zonal landscapes: Subarctic continental: 1 – Arctic tundra; 2 – typical tundra. Subarctic Pacific: 3 – typical tundra; 4 – southern tundra. Boreal-subarctic forest tundra: 5 – continental and sharply continental. Boreal, transitory to subarctic: 6 – Pacific. Boreal typically continental: 7 – northern taiga; 8 – middle taiga; 9 – southern taiga. Boreal typical Pacific: 10 – middle and southern taiga. Boreal, transitory to sub-boreal: 11 – pacific. Sub-boreal humid broadleaf: 12 – Pacific.
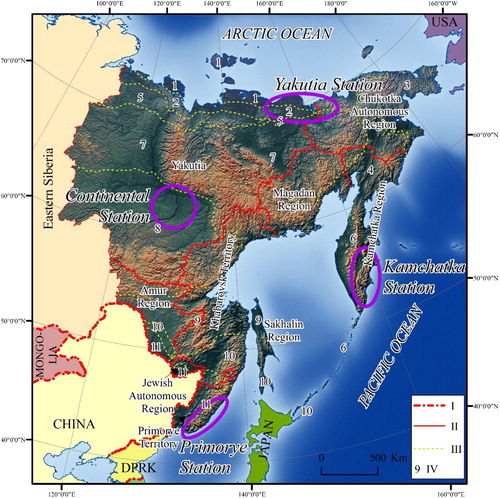
Table 1. Average air temperature of the basic climatic zones of the Far East (°С).
Table 2. Zonal landscapes in the Far Eastern Russia
Table 3. Land cover types of the Russian Far East.
Table 4. Dynamics of forest land in the Russian Far East (Hansen et al. Citation2013).
Figure 2. Changes in annual, winter (December–January–February) and summer (June–July–August) mean temperature (left, unit K per 1 K of global mean temperature change) and precipitation (right, left, unit % per 1 K of global mean temperature change) in the Russian Far East in CMIP5 simulations. For these maps, the temperature and precipitation changes from 1986–2005 to 2081–2100 were first averaged over 143 CMIP5 simulations for the RCP2.6, RCP4.5, RCP6.0, and RCP8.5 scenarios and then divided by the 143-simulation mean global mean warming. While the absolute magnitude of the changes depends strongly on the RCP scenario, these normalized patterns are nearly the same for all the scenarios.
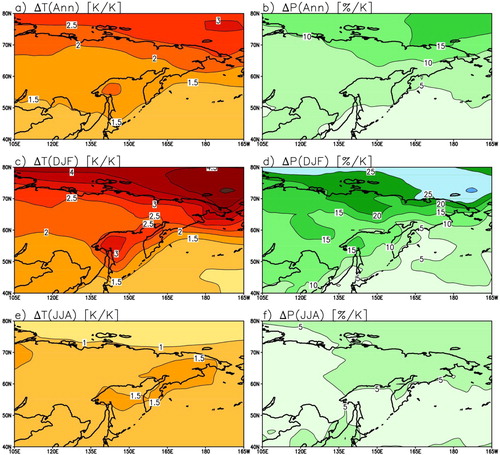
Figure 3. Seasonal (first four columns) and annual (rightmost columns) changes in (a) mean temperature and (b) precipitation near Yakutsk (grid box at 62.5°N, 130°E) from years 1986–2005 to 2081–2100 under the RCP4.5 scenario in 42 CMIP5 climate models. The individual model projections are shown with crosses, and the bars indicate their mean ± 1 standard deviation.
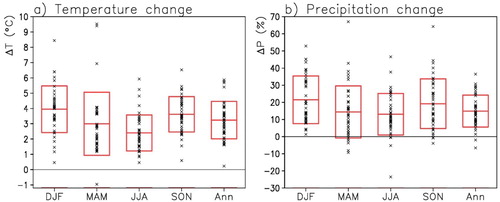
Table 5. Average annual area of forest fires, thousand ha (Natural Resources Use Citation2005; Regions of Russia Citation2008; Environmental protection Citation2010, Citation2016).
Table 6. Forest area affected by fires, thousand ha (China Statistical Yearbook Citation2004–2016; Regions of Russia Citation2008; Environmental protection Citation2010, Citation2016).
Figure 4. Area of forest fires in China, thousand ha (China Statistical Yearbook Citation2004–2016).
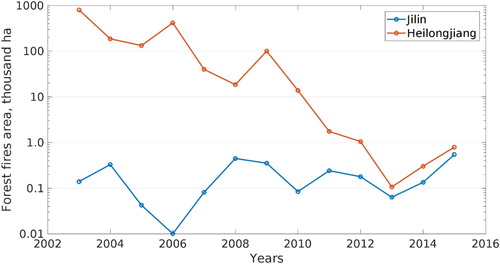
Table 7. Industrial and motor transport emissions of air pollutants, thousand tons (Main indicators Citation2011; Environmental protection Citation2016).
Table 8. Sulfur dioxide and nitrogen oxide air emissions from industrial sources, thousand tons (Environmental protection Citation2001, Citation2006, Citation2016; Main indicators Citation2011; Far Eastern Federal District Citation2011; China Statistical Yearbook Citation2004–2016).
Figure 5. Dynamics of рН and concentrations of sulfates and nitrates in precipitation from Sadgorod and Terney stations in 1981–2015 and 1983–2015, respectively.
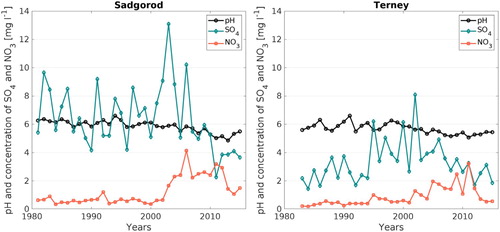
Figure 6. Concentrations of basic ions in rain and snow from Vladivostok, Terney, and EANET stations in 2012–2013.
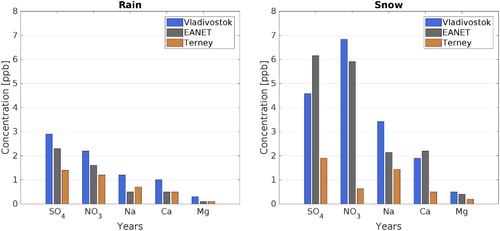
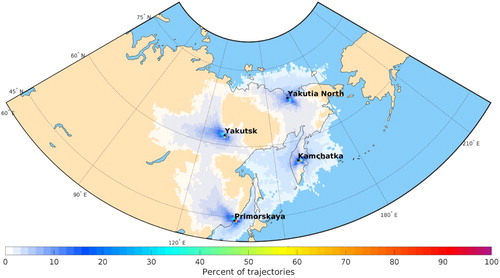
Figure 7. Meteorological representativeness of four potential observation sites in the Russian Far East.
Data availability statement
Data used in this paper are available from the authors upon request.