
Figures & data
Table 1. Summary of conditions needed for Geo Optics and IEM.
Figure 1. Study site in Greiner Lake watershed, Nunavut, Canada.
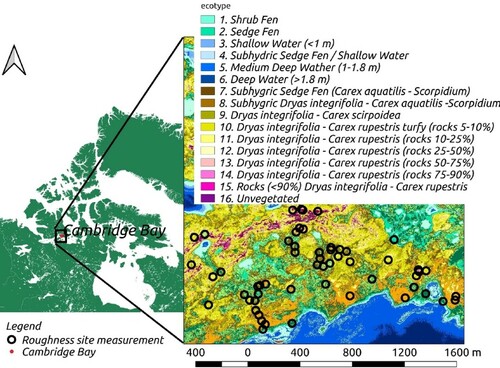
Figure 2. (a) 3D point cloud creation, (b) clipped 3D model to field of view of radiometer, (c) fitted plane to 3D surface and (d) histogram of perpendicular distances to plane, with cm and 2,787,233 points.
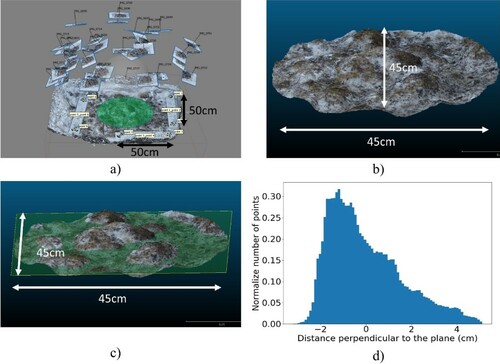
Table 2. Summary of radiometric observations and modeled downward atmospheric contributions.
Table 3. Parameters (Mont18) from optimization in Montpetit et al. (Citation2018) with different soil moisture permittivity from model of Zhang et al. (Citation2010).
Table 4. Mean value of roughness parameters measured with SfM photogrammetry.
Figure 3. Simulations using Weg99, QNH and Geo optics models based on roughness estimates from SfM. Permittivity from Zhang10 was used. Polarization ratio () used for Weg99 are (
,
) () and parameters for QNH defined in Section 2.2.
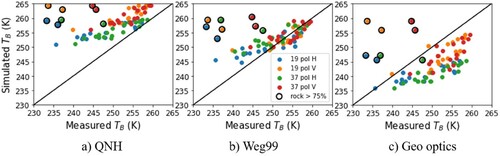
Table 5. Simulation results using roughness parameters from SfM and permittivity from Zhan10 model (dry: VMC = 0.05).
Figure 4. Simulated vs measured brightness temperatures for all models with optimized permittivity in (a), (b), and (c) and optimization results in (d).
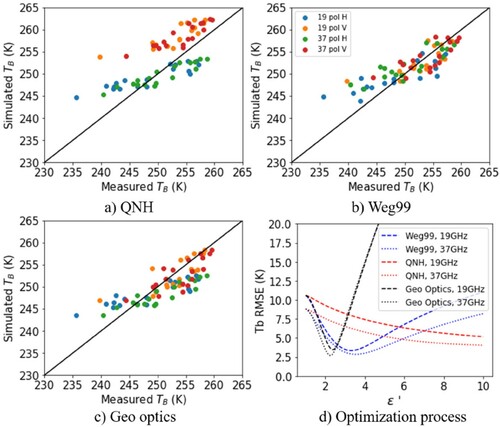
Table 6. Results from optimization of permittivity.
Figure 5. (a) Representation of RMSE as function of permittivity and bias in effective temperature of the rock > 75% sites with Weg99 model and roughness SfM. (b) Image of one of the rock sites. (c) Simulation with modification of ϵ' = 8.3 and a change in temperature of (from −9.4°C to −17°C) in (a) for rock sites.
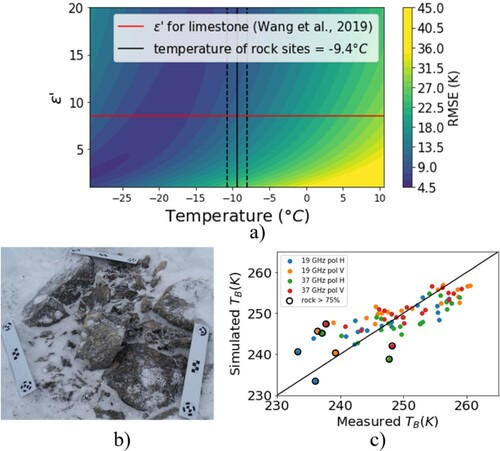
Table 7. Summary of simulation with a fixed SfM value of roughness for all sites without rock.
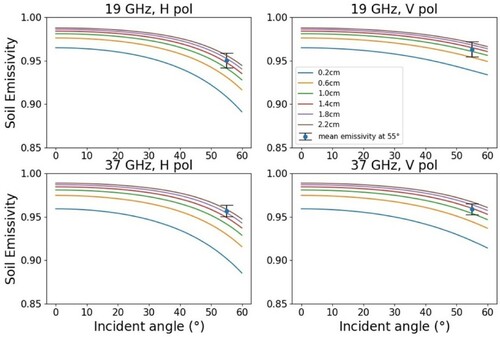
Figure 6. Sensitivity analysis on angular dependency of emission with different roughness values, for 19 and 37 GHz with horizontal and vertical polarization.
Data availability statement
All brightness temperatures and emissivity values will be available on request.