Figures & data
Figure 1. NIR photo of the snowpit on 22 February. The full snow profile was photographed two times. Firstly, a metal frame (37 × 120 cm size) was attached to the upper portion (a) of the profile and pictured; later, it was moved to the lower portion (b). Note that the topmost 12 cm was missed on this day when the snow was too loose to hold the frame.
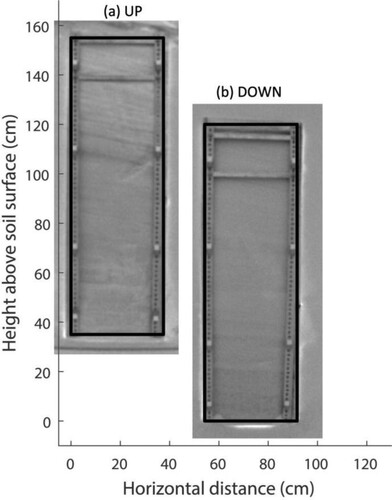
Figure 2. NIR photo of the snowpit on 23 February, photographed by the same method in .
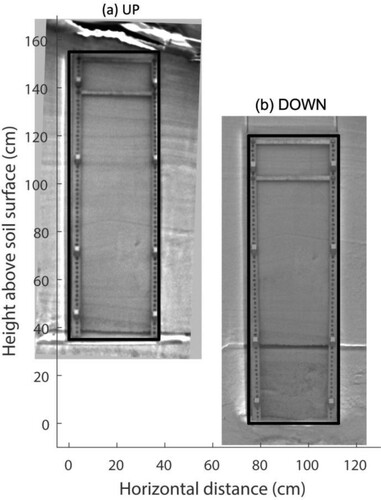
Figure 3. Stratigraphy, geometric grain size, and morphological classification according to Fierz et al. (Citation2009) for the snowpits on 22 February (a) and 23 February (b).
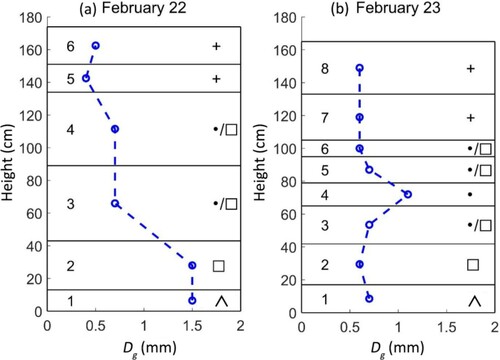
Figure 4. Stereological photographs of snow samples on February 22: (a) Layer 1 (depth hoar), (b) Layer 2 (facets), (c) Layer 3 (facets/round mix), (d) Layer 4 (facets/round mix). The vertical bar is a 1-mm ruler. The arrow indicates the upward direction in the snowpit.
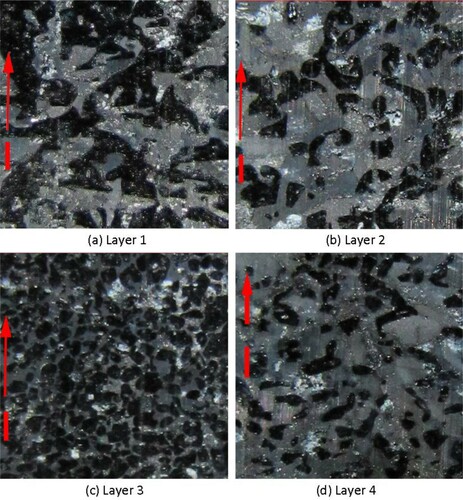
Figure 5. Stereological photographs of snow samples on February 23: (a) Layer 1 (depth hoar), (b) Layer 2 (facets), (c) Layer 3 (facets/round mix), (d) Layer 4 (rounds), (e) Layer 5 (facets/round mix).
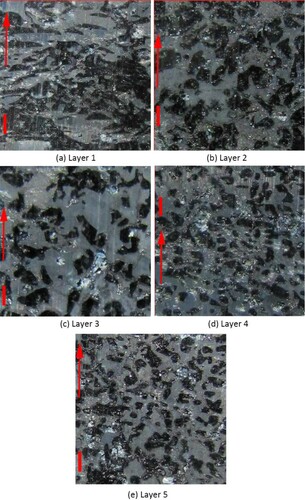
Figure 6. An example of cycloids overlaid on the stereological photo.
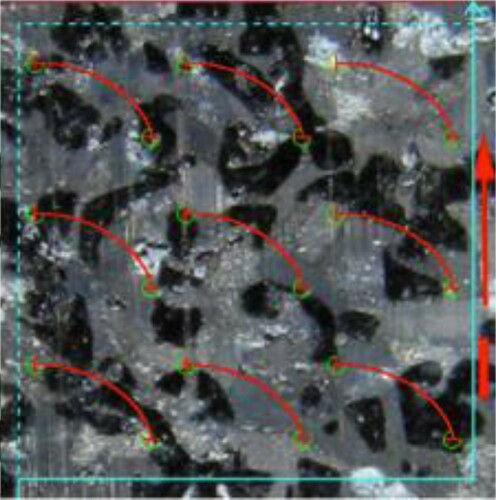
Figure 7. Comparison of measured S/V calculated from Ohio State University (OSU) and Swiss Federal Institute for Forest, Snow and Landscape Research (WSL) groups.
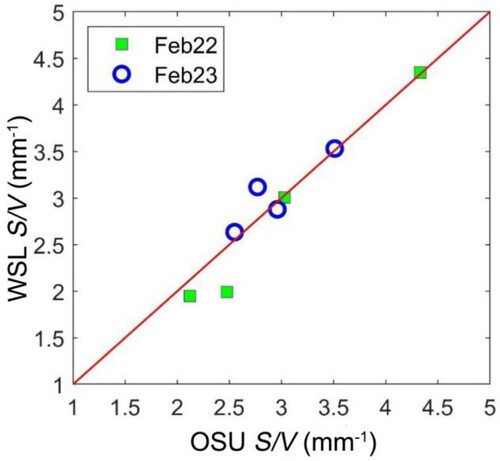
Table 1. Stereology analysis for the snowpit on February 22.
Table 2. Stereology analysis for the snowpit on February 23.
Figure 8. Profile of Le using different measurement tools: (a) February 22, (b) February 23. St. represents stereology. For all methods, the conventional conversion coefficients are used.
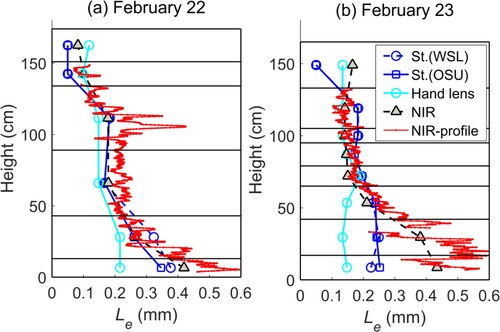
Figure 9. Error of predicted TB by MEMLS using Le from different methods: (a) 19 GHz on February 22, (b) 37 GHz on February 22, (c) 19 GHz on February 23, (d) 37 GHz on February 23. In each subplot, from left to right, Le is from: OSU stereology using βM and βO, WSL stereology using βM and βO, NIR photography using βM and βO, hand lens using αD and αO.
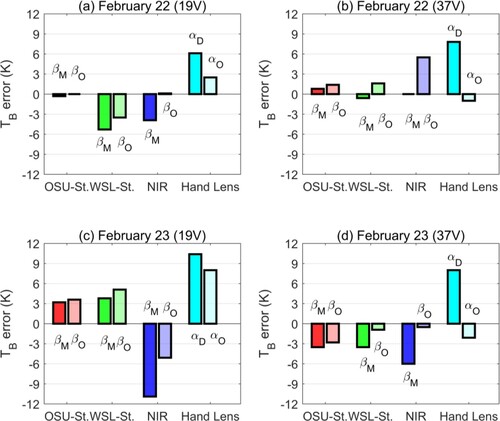
Table 3. Comparison of the measured and the MEMLS-predicted TB using stereology, NIR camera and hand lens measurements, when Le was converted by conventional conversion coefficients.
Table 4. Comparison of the measured and the MEMLS-predicted TB, when Le was converted by optimized conversion coefficients.
Table 5. Error Statistics of the MEMLS-predicted TB using different snow microstructure measurements and Le conversion coefficients.
Figure 10. Error of the MEMLS predicted TB as a function to unfrozen volumetric soil water content (mvu) (a) and soil roughness (b). The vertical gray dash lines represent the 12% mvu and 0.1 cm roughness used for simulations in Section 5.2.
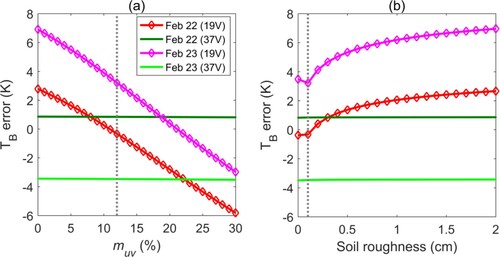
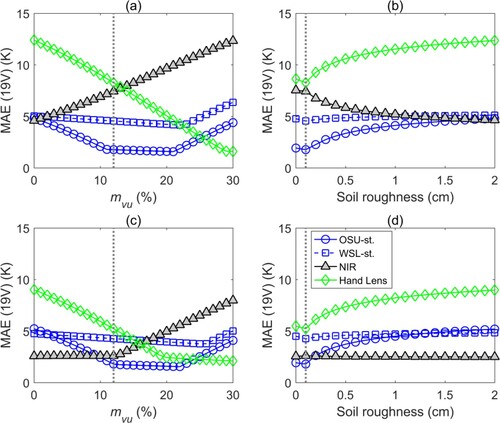
Figure 11. Sensitivity of MAE of the predicted TB at 19 GHz to unfrozen volumetric soil water content (mvu) and soil roughness based on different microstructure measurements: (a)-(b) used the conventional coefficients, (c)-(d) used the optimized coefficients. st. represents stereology.