
Figures & data
Table 1. Configurations of the L-band active-passive microwave sensor for TWRS.
Figure 1. Multiangular active-passive flights conducted during SMELR in 2018.
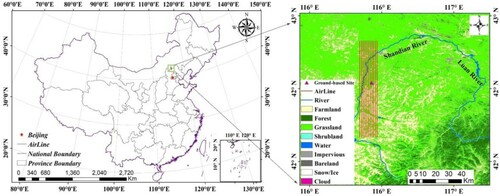
Figure 2. The linear relationship between Fresnel reflectivity for different polarization combinations at incidence angle 30° and 50°.
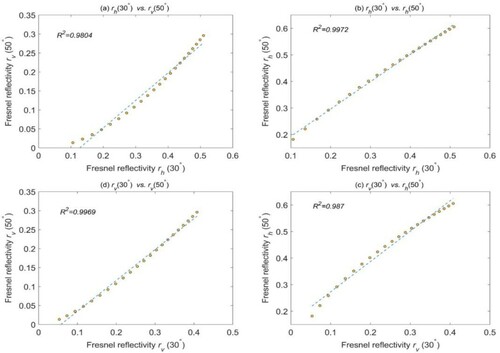
Figure 3. Determination coefficient (R2) between the Fresnel reflectivity h- and v-pol under all angle combinations from 0° to 65° with 2.5° intervals.
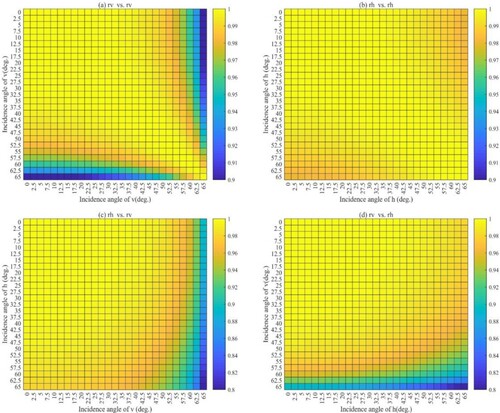
Figure 4. Brightness temperature (Tb) of the PALS dataset during SMEX02, aggregated Tb at 4 km, observed (reference) Tb at 0.8 km, and downscaled Tb from the TSR and SA downscaling algorithms at 0.8 km: (a) v-polarization; (b) h-polarization.
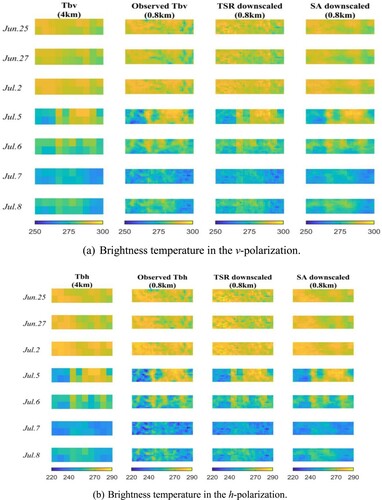
Figure 5. Comparison between the downscaled and observed brightness temperatures (Tb) resulting from the TSR and SA methods. The performance of each method was evaluated in terms of RMSE and correlation (R2) between the downscaled and reference values.
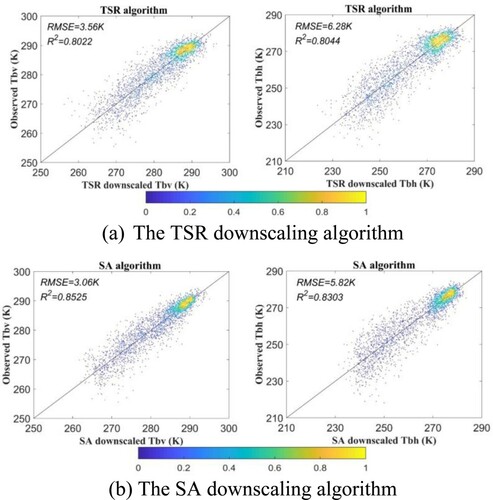
Figure 6. Variability of determination coefficient (R2) values as a function of incidence angles of the radar from 30° to 65° with 2.5° intervals.
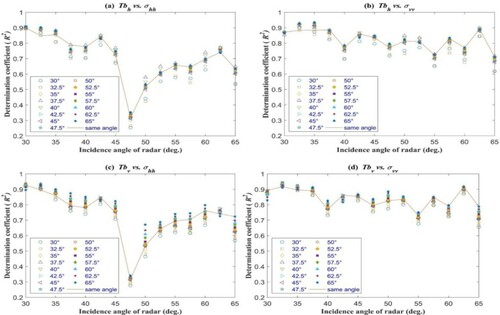
Figure 7. Determination coefficient (R2) between the L-band brightness temperature and backscatter coefficient under all angle combinations from 30° to 65° with 2.5° intervals.
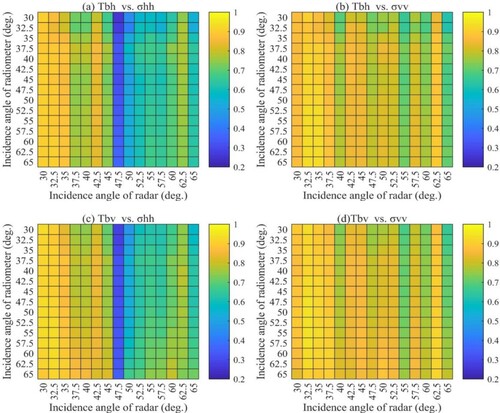
Figure 8. Brightness temperature (Tb) at an incidence angle of 27.5° from SMELR in 2018, aggregated Tb at 4 km, observed (reference) Tb at 1 km, and downscaled Tb from the TSR and SA downscaling algorithms at 1 km with incidence angle of radar backscatter at (a) 40°; (b) 42.5°; (c) 45° (d) 47.5°; (e) 50°; (f) 52. 5°.
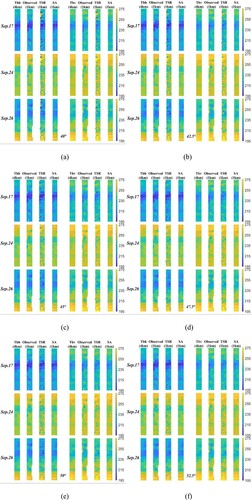
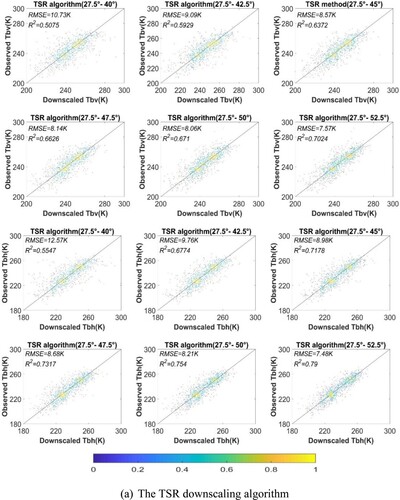
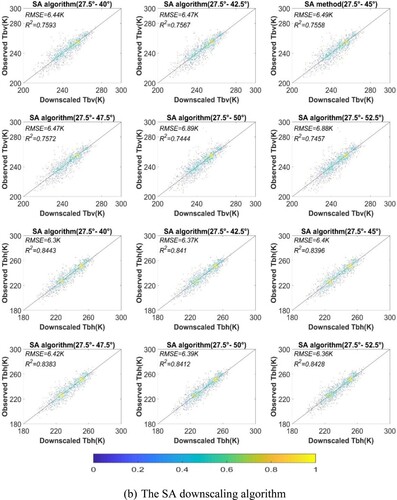
Table 2. Root mean square error (RMSE) between the downscaled brightness temperature (Tb) and reference Tb with respect to polarization and incidence angles.