Figures & data
Figure 1. Spatial variation of annual average precipitation, maximum temperature, minimum temperature, and potential evapotranspiration (PET) in India. Comparison of monthly (average) variation of precipitation, maximum temperature, minimum temperature, and PET in A to D graphs (A=precipitation; B=maximum temperature; C=minimum temperature, and D=PET). Monthly and annual average were estimated using data from 1951 to 2015.
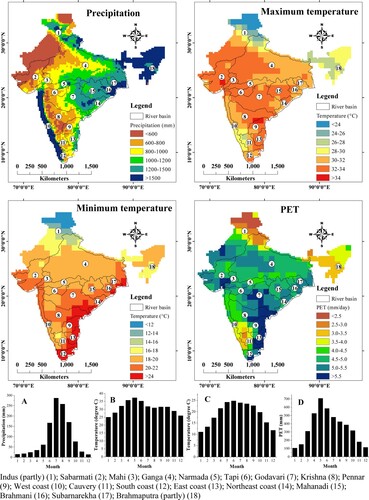
Figure 2. Trend in precipitation, temperature (maximum and minimum), and PET on annual time scale from 1951 to 2015. Precipitation and PET were calculated in total amount in a year and temperature is in average value. Line with square marker shows actual value, line with round marker shows 5-years moving average (estimated from actual), and straight line shows best fit line (linear regression) using actual value. Temperature (minimum and maximum) and PET trend were increasing while precipitation was decreasing.
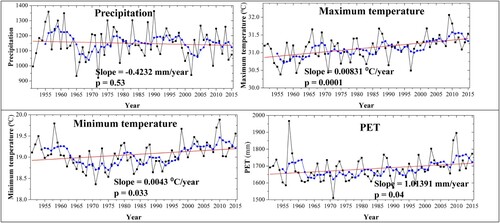
Figure 3. Comparison of areal extent (%) of droughts using SPI and SPEI from 1951 to 2015 in India. Droughts were estimated on long term time scales (24, 48, and 60 months). Top five drought years were observed in 1966 to 1969, 1987 to 1988, and 2002 to 2005 except 1972 (SPI24). Drought area was considered as < -1.2 of SPI/SPEI.
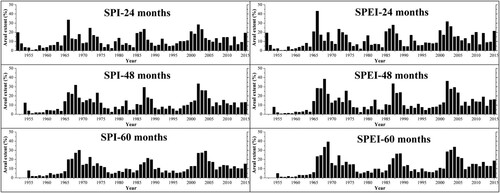
Table 1. Drought extent and drought events (basin-average) in Indian river basins (1951–2015).
Table 2. Drought frequency and drought intensity (basin-average) in Indian river basins (1951–2015).
Figure 4. Changes in long term (24, 48, and 60 months) drought area (% per year) in Indian river basins (eighteen river basins) by SPI and SPEI methods for the period of 1951-2015. Changes were estimated using liner regression for computing slope (statistically significant or not at the 5% level) using the area in percentage (%) of droughts (1951-2015). A p value of less than 0.05 indicates statistically significant changes.
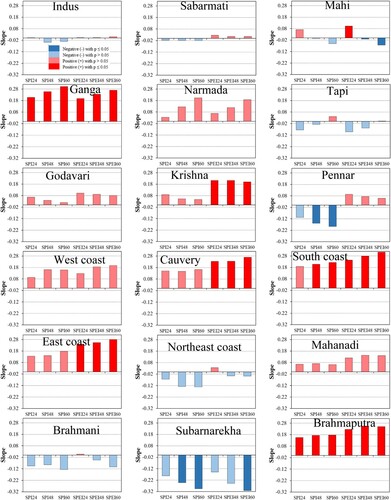
Figure 5. Changes in total water storage (TWS) in Indian river basins from 2002 to 2015. Changes in TWS were estimated by liner regression for estimating slope, indicating statistically significant changes at the 5% level (p value of less than 0.05).
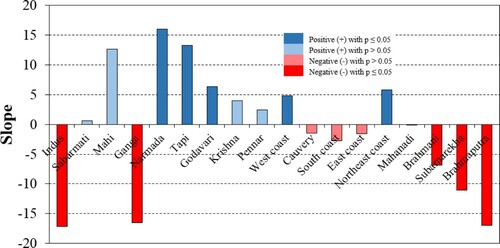
Figure 6. Correlation between droughts (SPI and SPEI methods with time scale of 24, 48, and 60 months) and TWS during 2002-2015. Correlation with statistically significant or not at the 5% level (p value less than 0.05) was estimated. Strong correlation indicates that the drought strongly impacts TWS.
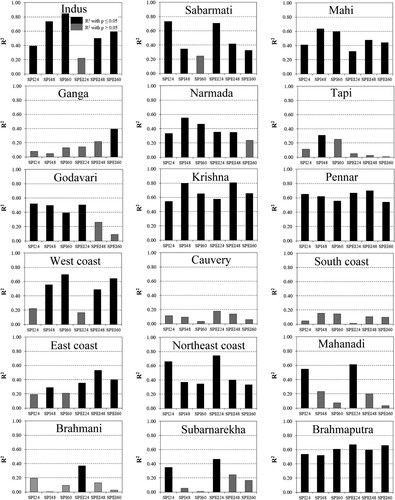
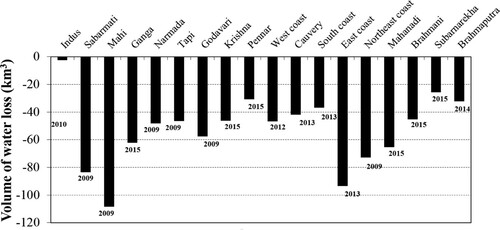
Figure 7. Estimation of total water loss using TWS during 2002-2015 in Indian river basins with statistically significant or not at the 5% level (p value less than 0.05). Volume of total water loss was estimated using slope (linear regression method) of TWS.
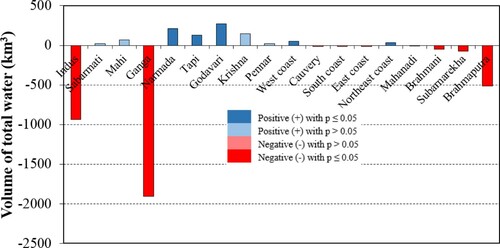
Figure 8. Estimation of water loss using TWS due to the most recent long-term drought in various river basins in India.