
Figures & data
Table 1. Statistics on service industry CO2 emissions, traffic CO2 emissions, secondary industry CO2 emissions, total CO2 emissions, and nighttime lights in Chinese cities.
Figure 1. The spatial distribution of the study area.
Note: the numbers in brackets represent the population and the number of cities, respectively.
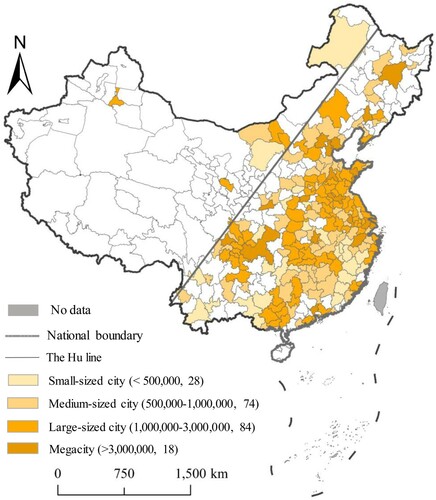
Figure 2. The corrected Suomi NPP-VIIRS data from 2012 and 2015.
Note: Enlarged views on the right are pictures for the Beijing-Tianjin-Hebei, the Yangtze River Delta, and the Pearl River Delta. By comparing the blue areas, the luminous intensity in 2015 was found to be higher than that in 2012 in some regions.
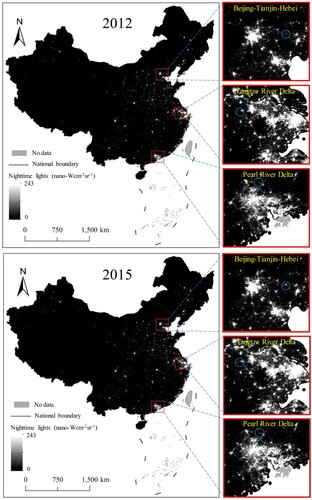
Table 2. Correlations between nighttime lights and service industry CO2 emissions for all selected cities.
Figure 3. The relationship between nighttime lights and TC, IC.
Noted: TNT, IC TC represent total nighttime lights, secondary industry CO2 emissions, and traffic CO2 emissions, respectively. Note: logarithmic transformation can be more intuitive to find the data relationship, and convenient for statistical inference.
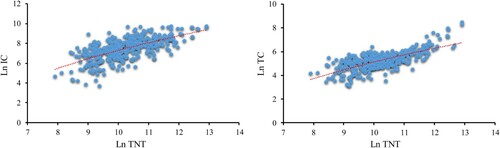
Table 3. Correlations between nighttime lights and traffic CO2 emissions for all selected cities.
Table 4. Correlations between nighttime lights and secondary industry CO2 emissions for all selected cities.
Supplementary_Material
Download MS Word (97.5 KB)Data availability statement
The monthly Suomi NPP-VIIRS data are openly available in Earth Observation Group at https://payneinstitute.mines.edu/eog/. China’s city CO2 emissions were collected from China City Greenhouse Gases Emissions Datasets.