
Figures & data
Figure 1. The configuration of the radiometer observation experiment (Li et al. Citation2019).
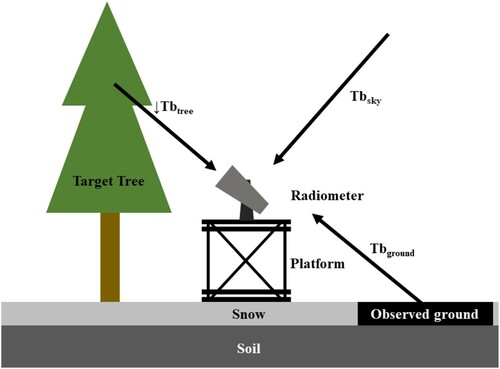
Figure 2. Time series of snow depth (upper panel) and environmental temperatures (lower panel) in IOA.
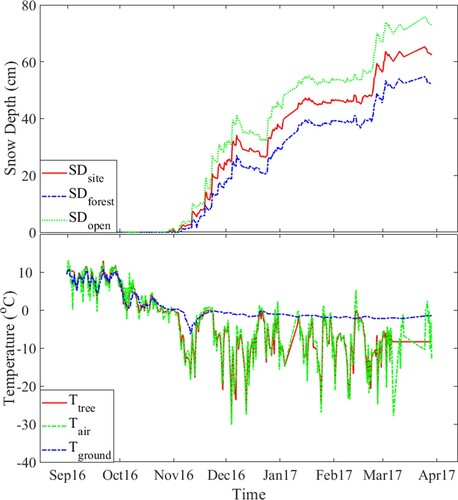
Table 1. Estimated parameters, R2, and the RMSE of transmissivity model.
Figure 3. Schematic illustration of the influence of forest biomass on the observation of ground ΔTb.
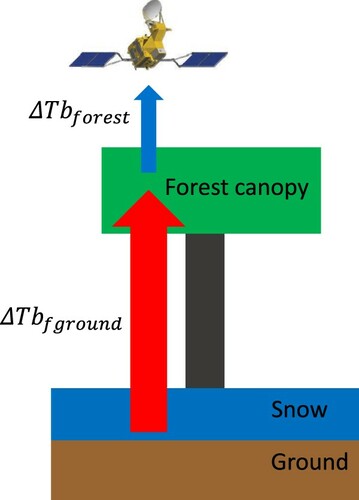
Figure 4. Schematic illustration of terms in Equation (6).
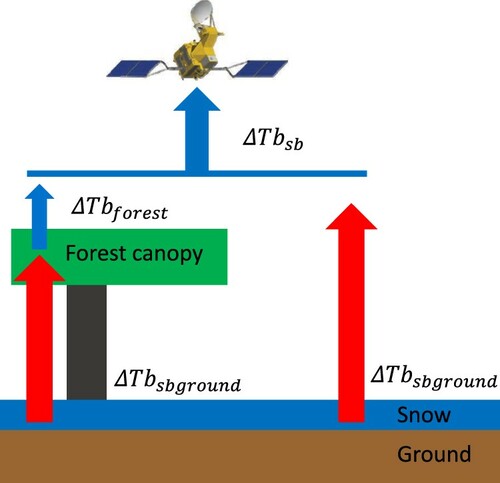
Figure 5. Radiometer-observed ΔTb of Tbground (blue-green-red circle markers) with the (7) simulated results (black solid lines), the blue-green-red bar represents Tair.
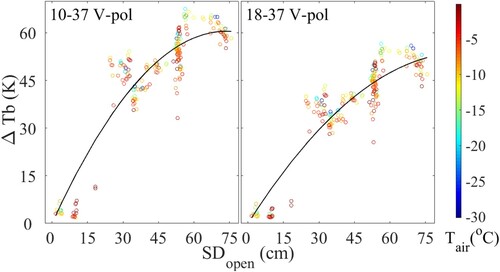
Table 2. Estimated parameters, R2, and RMSE of Equation (7).
Figure 6. Comparison between ΔTbRTforest (blue-green-red circle markers) and ΔTbAPPforest which is simulated at equal to 10, 20, 30, 40, and 50 K by (4) (lines), the blue-green-red bar represents SDopen.
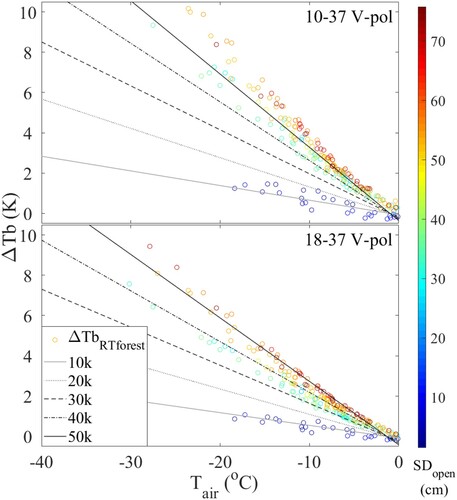
Table 3. Estimated parameters bis and cis, and corresponding R2, and RMSE of (4) against RT model (1) for the model calibration.
Figure 7. Comparison between ΔTbAMSR (blue-green-red circle markers) and ΔTbAPPsb which is simulated at snow depths equal to 10, 25, 40, 55, and 70 cm (lines), the blue-green-red bar represents SDAMSR.
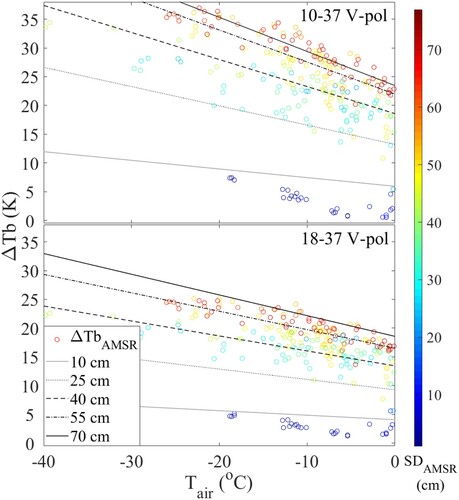
Table 4. The estimated parameters bsb and csb, and the corresponding R2, and RMSE of (6) against ΔTbAMSR during the model calibration with training dataset.
Figure 8. ΔTbAPPsbground (blue-green-red circle markers) against Tair, the blue-green-red bar represents SDAMSR.
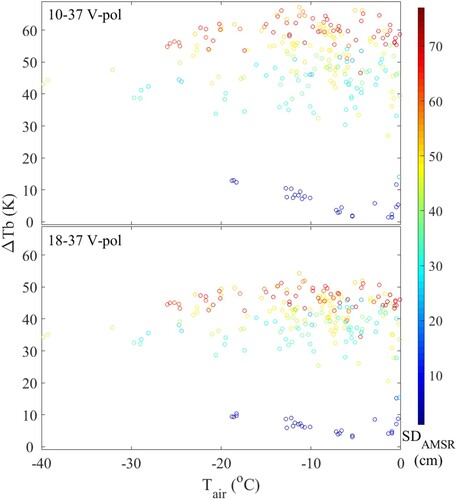
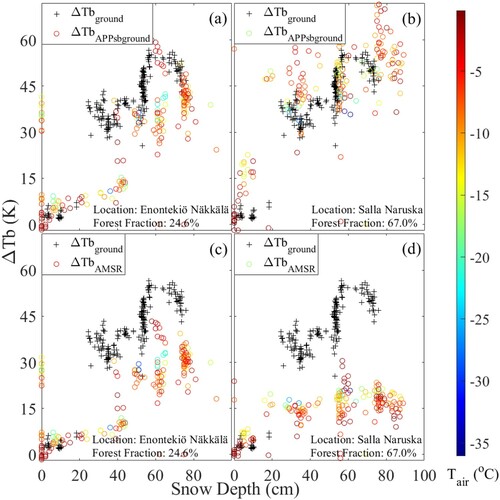
Figure 9. Compared ΔTbAPPsbground (blue-green-red circle markers in (a) and (b)) and ΔTbAMSR (blue-green-red circle markers in (c) and (d)) with the radiometer observed ΔTb of Tbground (black cross markers), the blue-green-red bar represents Tair.
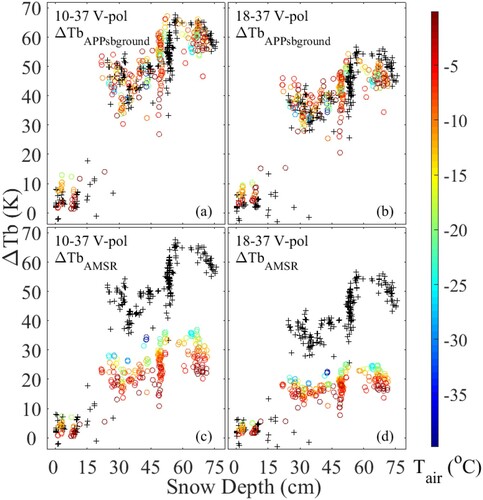
Figure 10. Comparison between ΔTbAMSR (blue-green-red circle markers) and ΔTbAPPsb which is simulated at snow depths equal to 10, 25, 40, 55, and 70 cm (lines), the blue-green-red bar represents SDAMSR.
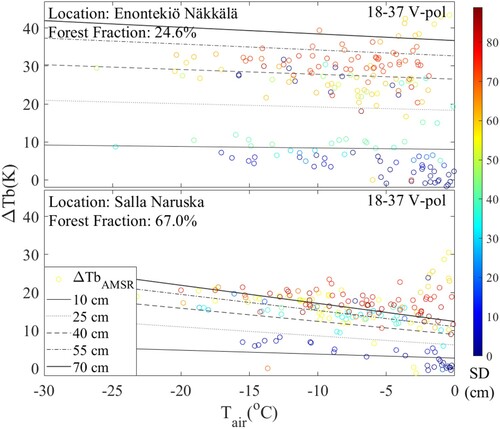
Figure 11. Compared ΔTbAPPsbground (blue-green-red circle markers in (a) and (b)) and ΔTbAMSR (blue-green-red circle markers in (c) and (d)) with the radiometer observed ΔTb of Tbground (black cross markers), the blue-green-red bar represents Tair.
Table