
Figures & data
Figure 1. The general workflow of the proposed method. Details of this workflow are explained in the texts.
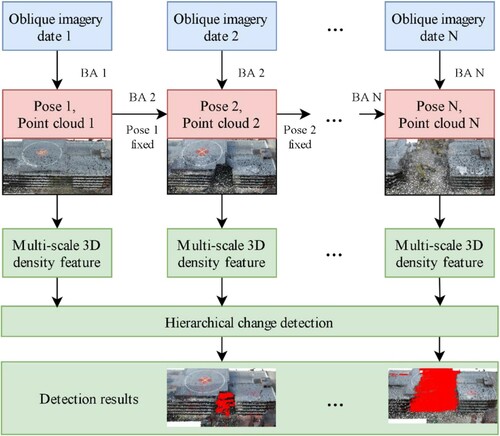
Figure 2. Profile analysis of an unchanged portion of surface throughout different dates showing the level of registration accuracy (statistics shown in ).
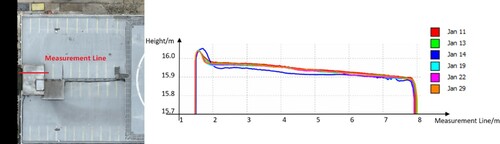
Table 1. Registration accuracy of temporal dataset with respect to the reference day (January 11, 2021).
Figure 3. Hierarchical change detection process of point clouds of two dates (first and the last). ‘Depth’ represents the scale level of the constructed octree. In each figure from (a) to (f), all points constitute the detection result at this depth. The final detection result shown in (f) is marked in all other figures as a reference. Points of other colors are the points to be removed at different depths. ‘Post-filtering’ in (f) was achieved by using connected components method. Colored print of this is available online.
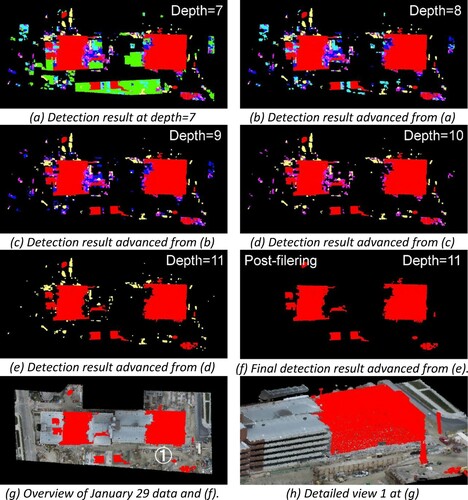
Figure 4. Study area is located at the North Cannon garage structures at The Ohio State University campus. Two adjacent buildings outlined in red are the object of interest that are subjected to demolition event during January–February of 2021.
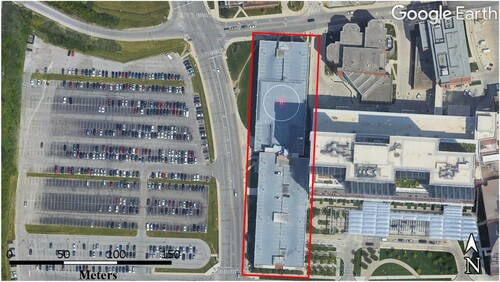
Figure 5. Flight trajectories of our monitoring mission with sequence numbers, visualization of the cameras produced by Pix4D software.
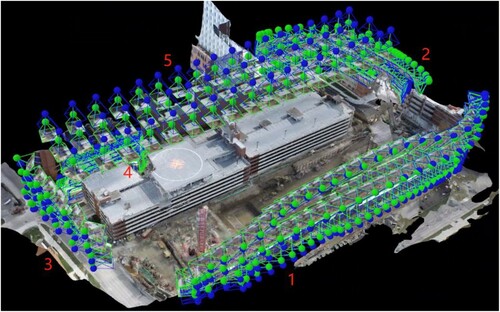
Figure 6. Reconstruction accuracy for the roof surface and façade surface of drone data. (1) is the roof area of drone point cloud and its error map with respect to airborne LiDAR (through the State of Ohio) while (2) is the facade surface of drone point cloud and its error map with respect to LiDAR (through a Leica RTC360 laser scanner).
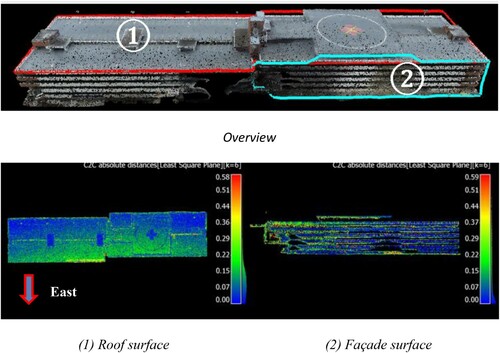
Table 2. The distance statistics of top-view and facade-view.
Figure 7. Change detection accuracy evaluation of date 1 (January11) and date 2 (January 29). The first row: overview of the four selected regions; The second and third rows: enlarged views of the results for the four regions. True positives (TPs), false positives (FPs), false negatives (FNs) are shown on the image. Color print of this figure is available online.
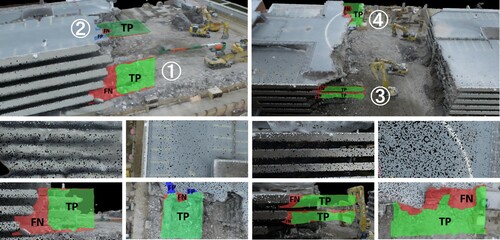
Table 3. Accuracy evaluation of the change detection for the selected regions.
Figure 8. Visualization of the building demolition process. The arrow indicates the directions of progression of demolition. Portion being demolished in different dates are colorized in differently for these different dates respectively follow the direction of the arrow: (January 11–January 13), (January 13–January 14), (January 14–January 19), (January 19–January 22), and (January 22–January 29). Color print of this figure is available online.
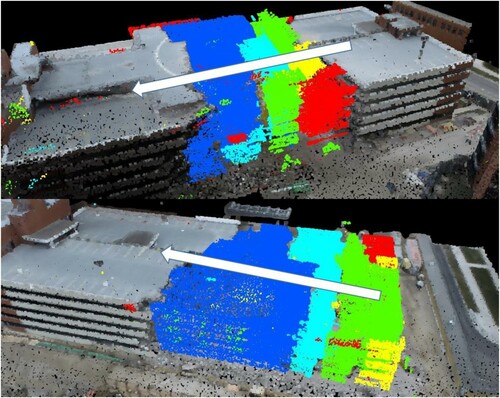
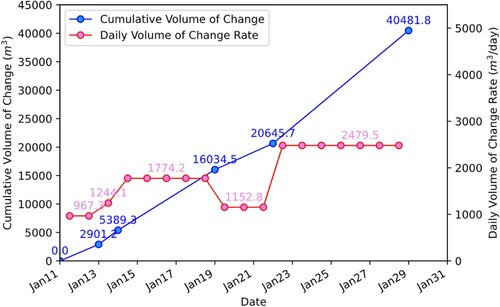
Figure 9. Cumulative volume change and daily volume change rate detected using the proposed framework.
Data availability statement
The data associated with this paper are produced by the authors; for any publicly available data, the authors have acknowledged the use of them in the Acknowledgement section.