
Figures & data
Figure 1. Study area in Ho Chi Minh city (false colour composite Sentinel-2 image).
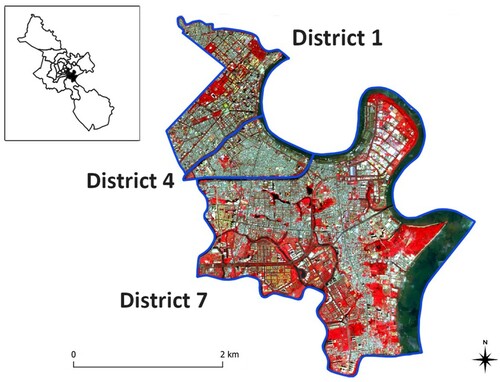
Figure 2. Reference data.
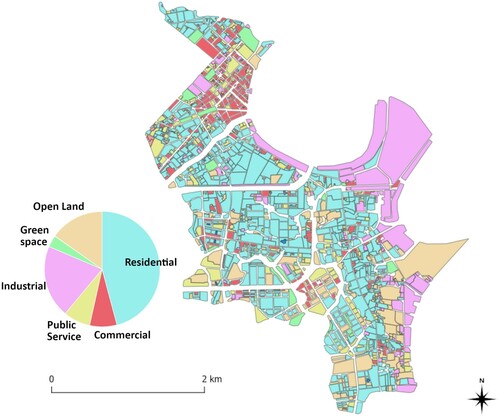
Figure 3. Typical commercial and residential areas as depicted with high-resolution Google Earth (left) and false colour composite Sentinel-2 images (right).
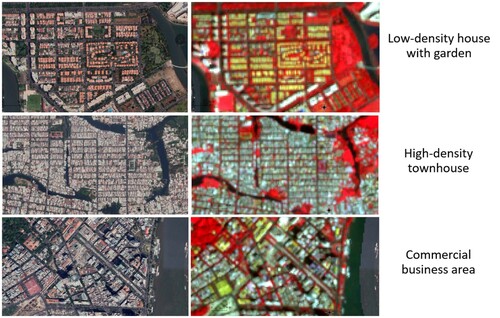
Figure 4. Sentinel-2 and OSM data fusion flowchart.
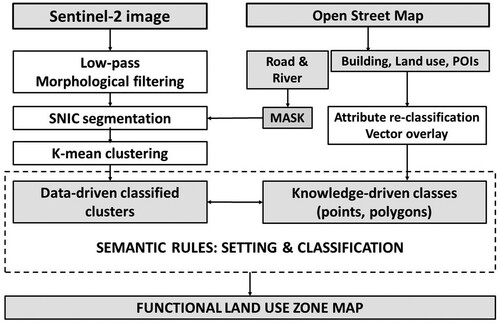
Table 1. Re-classified attributes of the four OSM layers.
Figure 5. The gap between human-knowledge and data-driven extraction for landuse mapping.
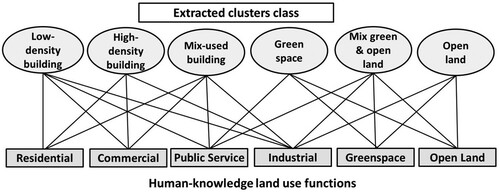
Figure 6. Applied ontology in fusion and classification.
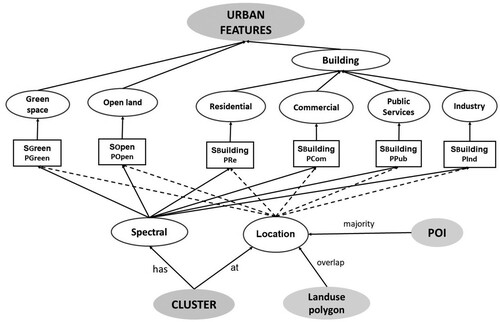
Figure 7. Segmented and classified result from Sentinel-2 image.
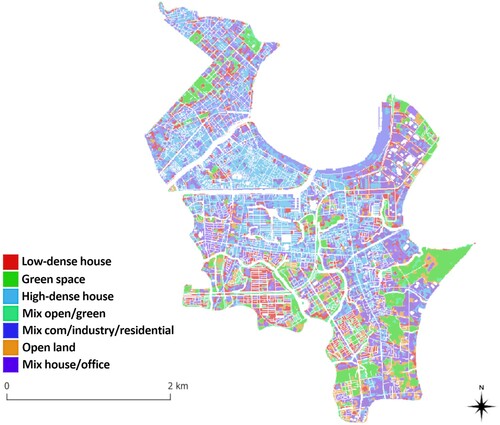
Figure 8. The distribution of extracted classes from Sentinel image within each knowledge-driven class.
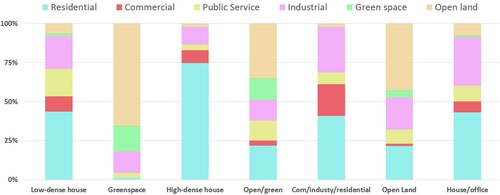
Figure 9. Functional landuse map derived from Sentinel-2 and OSM data.
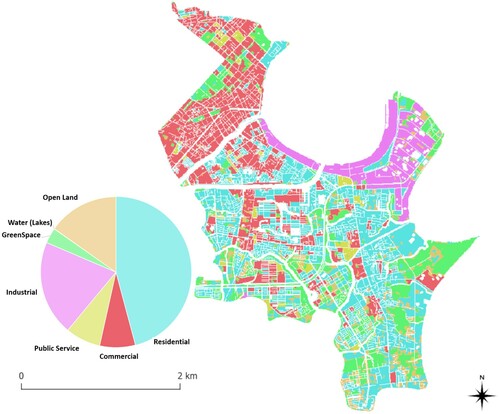
Figure 10. Distribution of reference objects in each detected class.
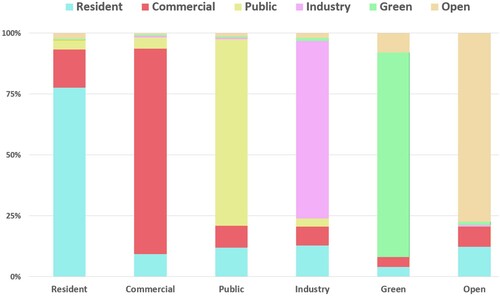
Table 2. Confusion matrix.
Data availability statement
The data that support the findings of this study are available on Google Earth Engine (https://earthengine.google.com) and Geofabrik (https://www.geofabrik.de).