
Figures & data
Figure 1. Level of detail (LOD) for buildings according to OGC CityGML 2.0 standard (source: authors).
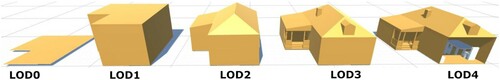
Figure 2. Experimental design: (a) plan of the fictitious city derived from topographic data (oriented north); (b) bird’s-eye view of 3D and 2D representations of buildings; and (c) first-person view of 3D and 2D representations of buildings in the TopoIVE from the starting point of the experiment, with user height set at 175 cm (source: authors).
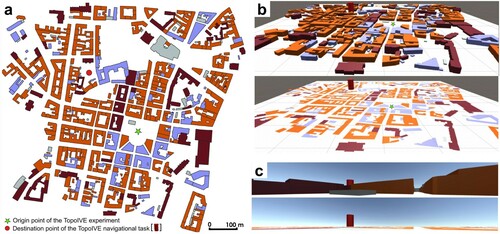
Figure 3. Mental rotation test (MRT) to measure the spatial ability of participants involved in the study (adapted from Vandenberg and Kuse Citation1978).
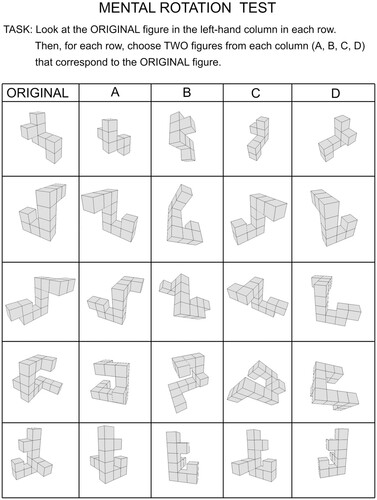
Figure 4. 3D (left) and 2D (right) mode in the pre-experiment HMD VR app (source: authors).
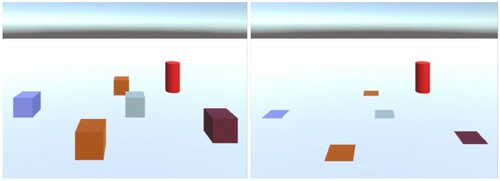
Figure 5. The experimental procedure (left), setup and equipment (top-right), and plan of the TopoIVE (bottom-right). The participant’s location in the TopoIVE and their view is presented in real-time on the laptop display for monitoring by the researchers. A video indicating what participants saw in the HMD when conducting the experiment is available at: https://youtu.be/TFcdyX_txfc.
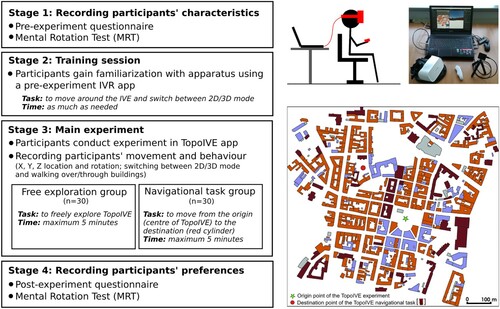
Table 1. Participants’ stated motivations for choosing the mode of representation in the TopoIVE.
Figure 6. Percentage of time that participants from both groups spent in 2D and 3D modes of representation and their preferences.
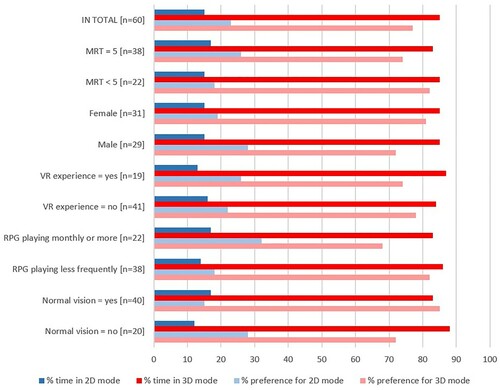
Figure 7. Percentage of time that participants in the free exploration group spent in 2D and 3D modes of representation and their preferences.
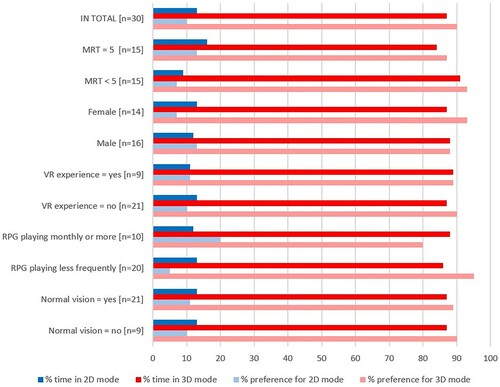
Figure 8. Percentage of time that participants in the navigational task group spent in 2D and 3D modes of representation and their preferences.
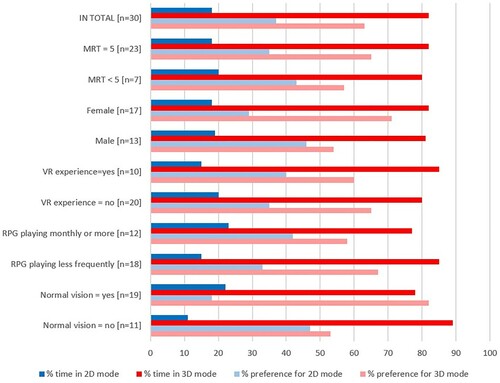
Table 2. Number of switches between modes and mode preferences from the post-test questionnaire for participants of both groups.
Table 3. Number of switches between modes and mode preferences from the post-test questionnaire for participants in the free exploration group.
Table 4. Number of switches between modes and mode preferences from the post-test questionnaire for participants in the navigational task group.
Figure 9. Box plot indicating the frequency of switching between 2D and 3D modes of representation for male and female participants from both groups.
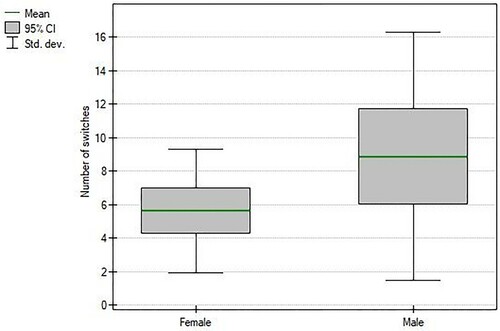
Figure 10. Box plot indicating the frequency of switching between 2D and 3D modes of representation and participants’ post-experiment mode preferences from both groups.
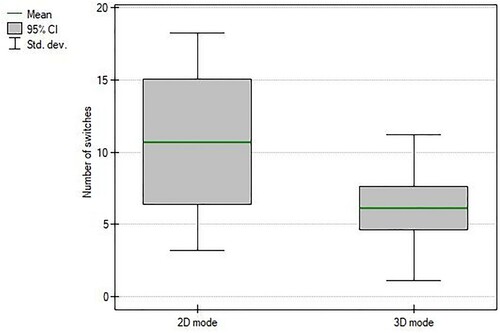
Figure 11. Tracks of participants in the TopoIVE from (a) the free exploration group (n = 30), and (b) the navigational task group (n = 30), with blue lines indicating the tracks recorded after participants had reached their destination.
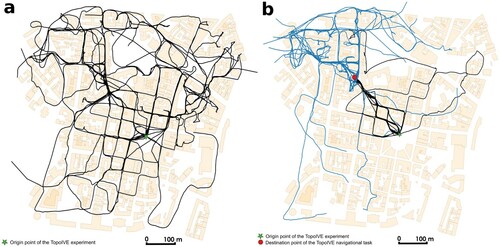
Figure 12. Box plot indicating the total route length for participants from both groups (p-value = 0.017896).
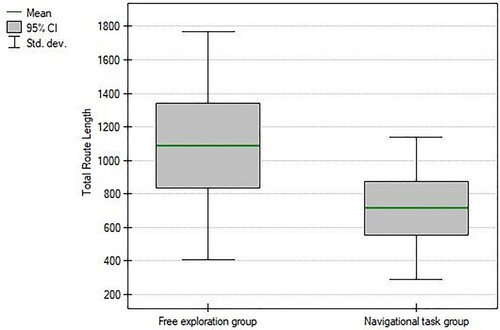
Figure 13. Box plot indicating the total route length for participants with MRT <5 and MRT = 5 from both groups (p-value = 0.002439).
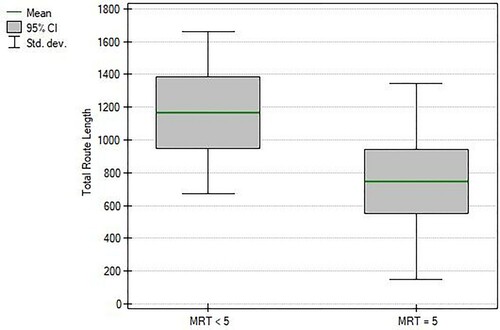
Figure 14. Tracks of participants in (a) the free exploration group, and (b) the navigational task group while using 2D mode.
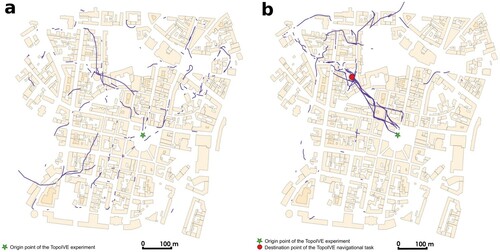
Figure 15. Tracks of participants in (a) the free exploration group, and (b) the navigational task group while using 3D mode.
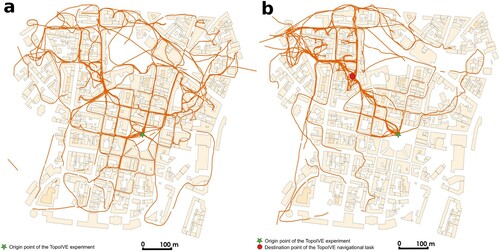
Figure 16. Track densities of (a) male participants from both groups (n = 29), and (b) female participants from both groups (n = 31).
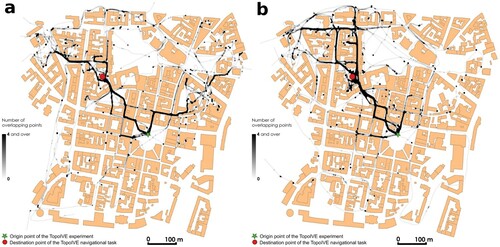
Figure 17. Track densities of (a) male participants in the free exploration group (n = 16), and (b) female participants in the free exploration group (n = 14).
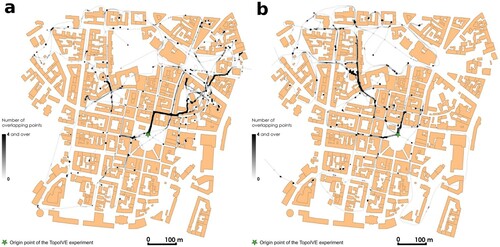
Figure 18. Track densities of (a) male participants in the navigational task group (n = 13), and (b) female participants in the navigational task group (n = 17).
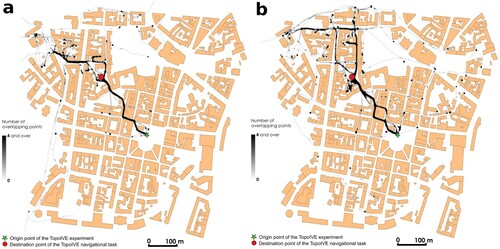
Figure 19. Box plot indicating the count of route segments in the 3D mode for male and female participants from both groups whose MRT score is 5 (p-value = 0.037845).
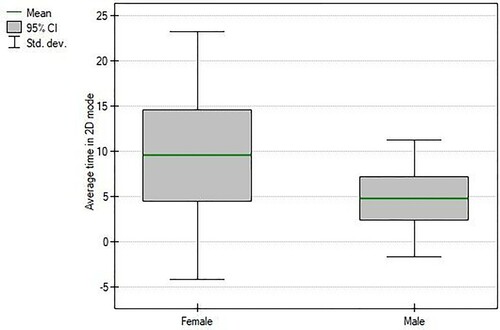
Figure 20. Box plot indicating the average time in the 2D mode for male and female participants from both groups (p-value = 0.039079).
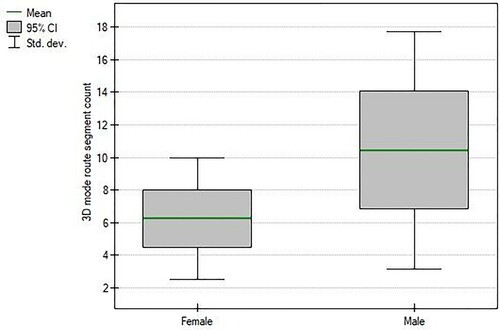
Table 5. Percentage of participants who walked over/through buildings while using 2D/3D mode.
Data availability statement
Data available within the article or its supplementary materials.