
Figures & data
Figure 1. Illustrations of the population disaggregation methods. (a) Choropleth map. (b) Areal weighting. (c) Pycnophylactic. (d) Binary dasymetric. (e) Multi-class dasymetric. (f) Intelligent dasymetric.
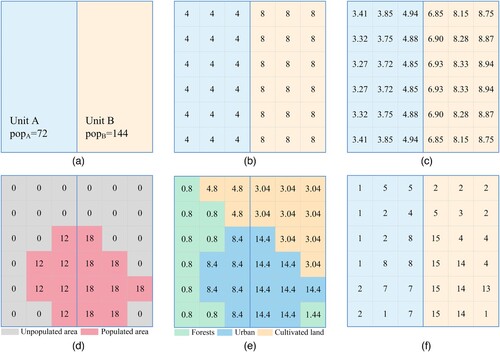
Table 1. Disaggregated population products and their main characteristics.
Table 2. SDGs Global Indicator Framework (as of 2020) and indicators that can be supported by disaggregated population data.
Figure 2. Illustration of disaggregated population data applications.
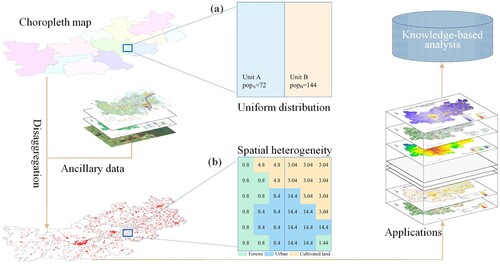
Figure 3. Accessibility of health centers in Deqing County (from Qiu et al. Citation2019).
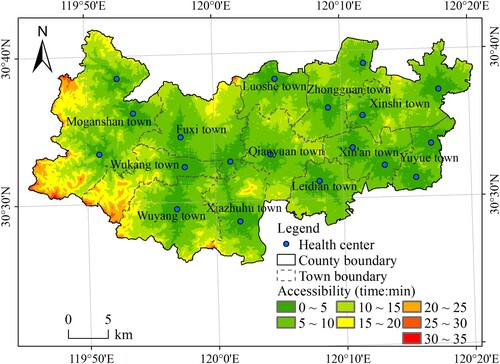
Table 3. Percentage and cumulative percentage of the population who could reach a health center within each time interval based on population statistical data and disaggregated population data (cite from Qiu et al. Citation2019).
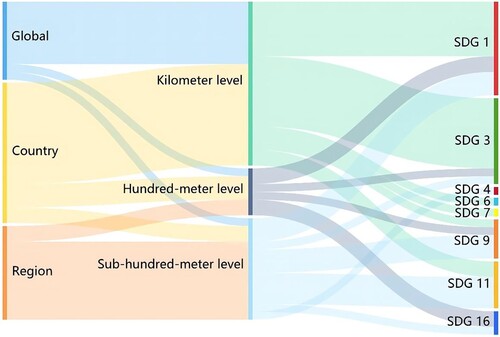
Figure 4. The frequency of use of disaggregated population data with different spatial resolutions in indicator evaluation applications at global, national, and regional levels.
Data availability statement
Data sharing is not applicable to this article as no new data were created or analyzed in this study.