Figures & data
Figure 1. Research area and spatial distribution of cities.
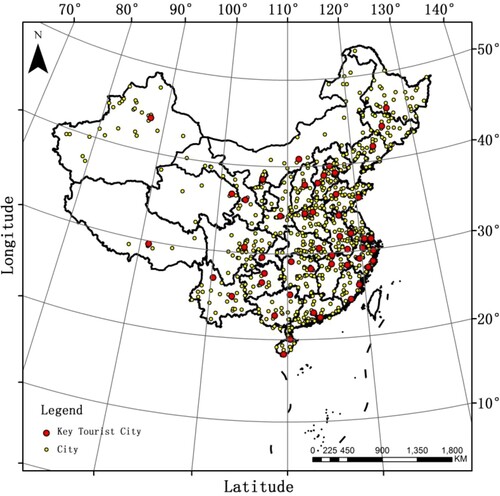
Table 1. Questionnaire results of Delphi index system building in the first stage.
Table 2. Index system for evaluating the suitability of the environment for tourism with levels of expert approval for different indicators.
Figure 2. Technology roadmap of the AHP–TOPSIS algorithm.
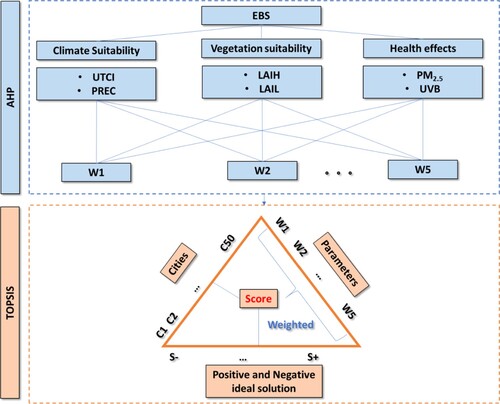
Table 3. Judgment matrix scale.
Figure 3. Spatial distribution of the annual average suitability of the environment for tourism in China in 2019.
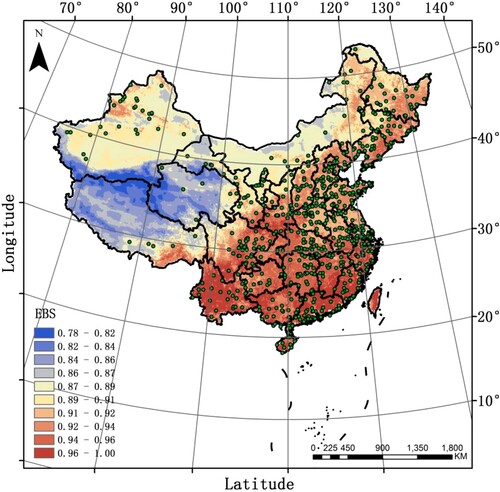
Figure 4. First principal component scores of 684 cities in China.
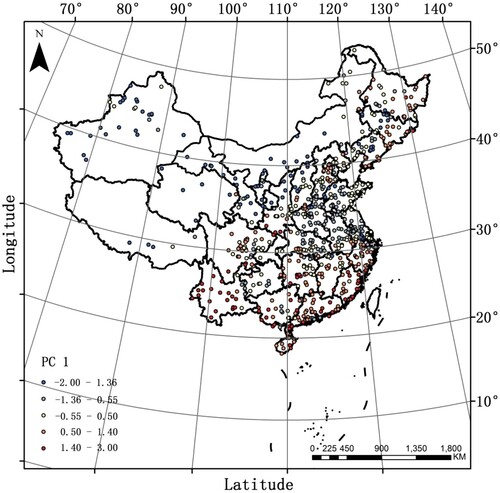
Figure 5. Number of days suitable for tourism in the 684 cities across China.
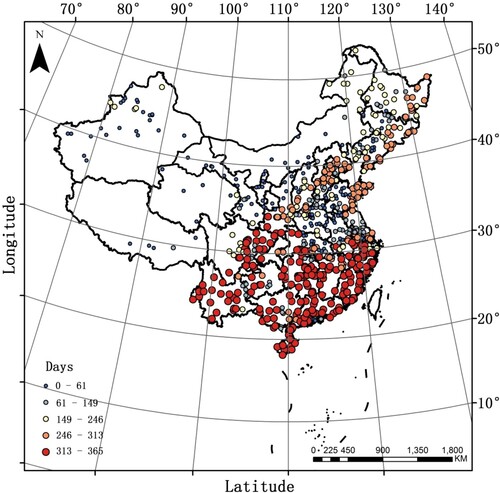
Figure 6. Seasonal proportions of the days suitable for tourism in the 684 cities across China.
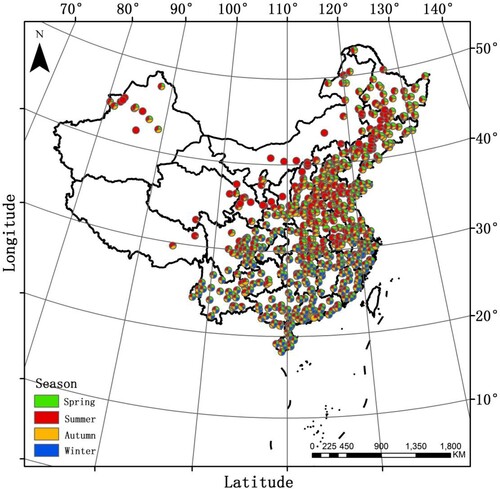
Figure 7. Monthly average values of the EBS and normalized parameters (UTCI, PREC, LAIH, LAIL, PM2.5 and UVB) for 12 selected cities.
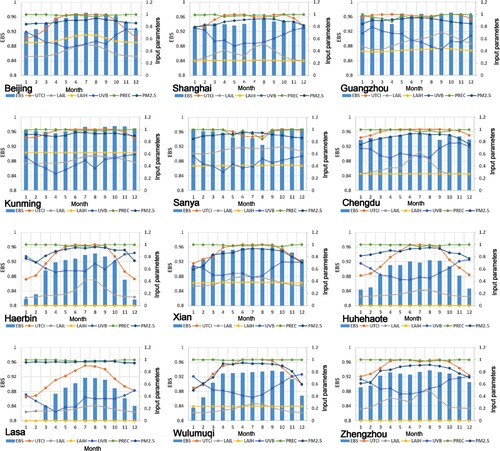
Table 4. Ranking of 50 representative tourist cities in terms of environmental suitability in 2019.
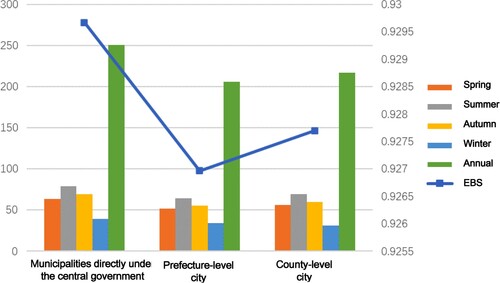
Figure 8. Differences between the environmental suitability of cities at different administrative levels.