
Figures & data
Figure 1. The conceptual model for the unified expression of natural resource entities.
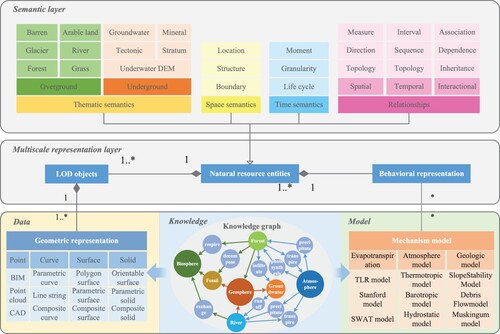
Figure 2. Description of hierarchical levels of details and semantic information.
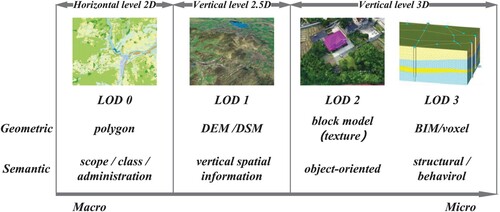
Figure 3. Classification hierarchy of natural resource entities.
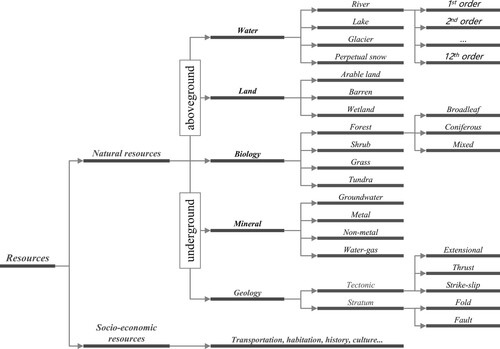
Figure 4. The different presentations of natural resource spatial relationships between the 2D and 3D aspects. (a) Spatial relationships from the 2D horizontal aspect and (b) spatial relationships from the 3D vertical aspect.
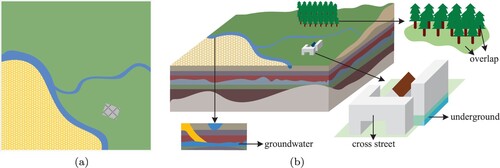
Figure 5. A 3D Cartesian coordinate system, with origin A and axis lines X, Y and Z, oriented as shown by the arrows.
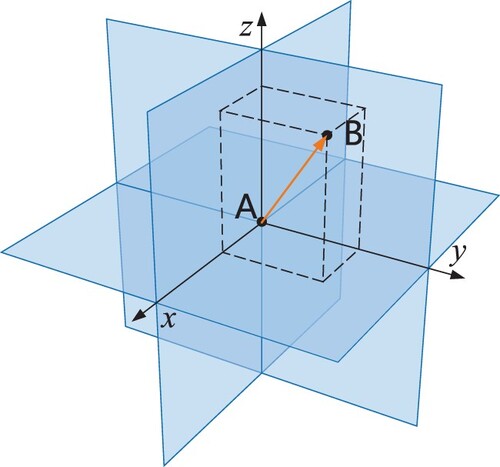
Figure 6. UML diagram of natural resource entity logical model.
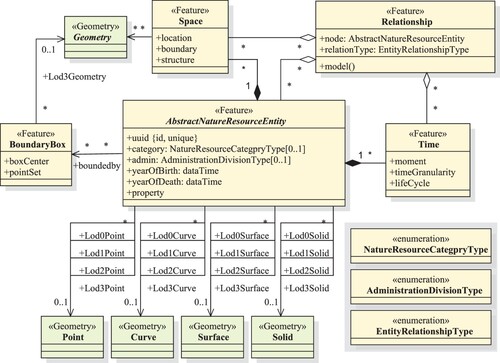
Figure 7. Spatiotemporal relationship graph based on an RDF triple; designed to support spatiotemporal query and higher order inference. (a) The structure of the spatiotemporal relationship graph and (b) UML diagram of the spatiotemporal relationship based on RDF.
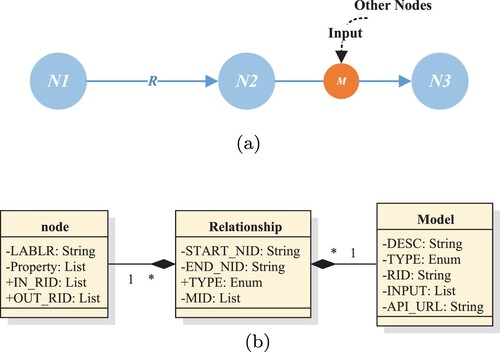
Figure 8. Schematic diagram of the structure of the spatiotemporal relationship graph with the time node added.
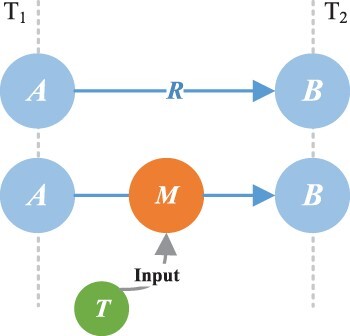
Figure 9. Schematic expression of the continuous and discrete changes between nature resource entities.
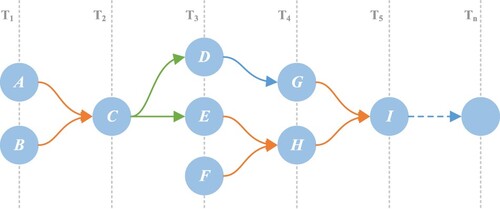
Figure 10. Schematic diagram of the structure of the spatiotemporal relationship graph with the space and time node added.
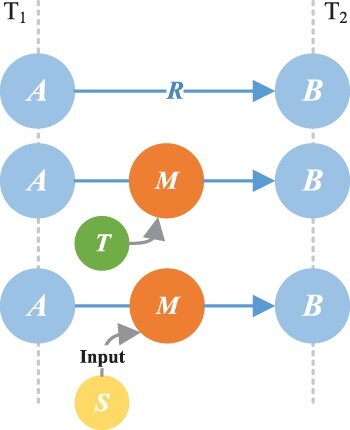
Figure 11. The comparison of two query patterns. (a) The target structure. (b) Eligible matching result through structural matching. (c) The target structure considering the semantics of nodes and edges and (d) The accurate matching result of both structural and semantic matching.
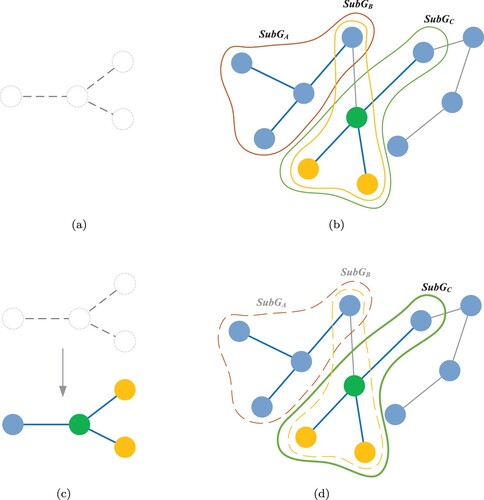
Figure 12. The synergy query process between the relationship, space, time, and attribute semantics.
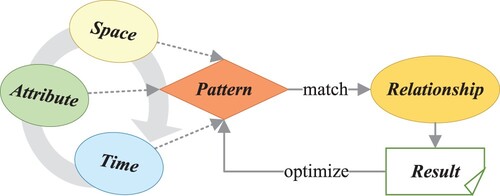
Figure 13. Representation of the river entity at multiple scales.
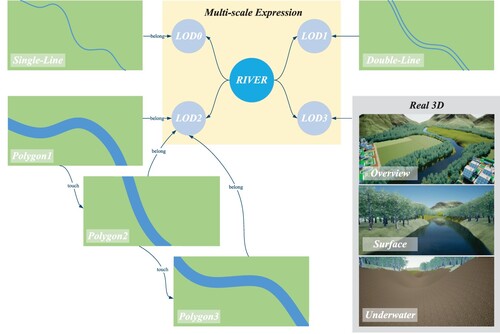
Figure 14. Visualized scene of natural resource entities and disasters along with knowledge graph update process.
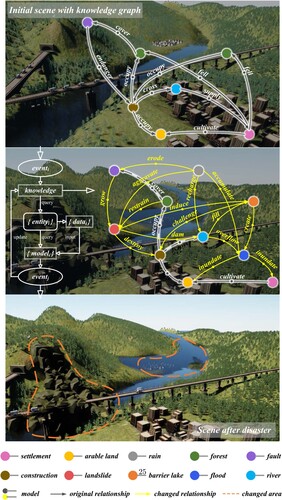
Figure 15. Visualization of natural resources surrounding the river and interactional relationships.
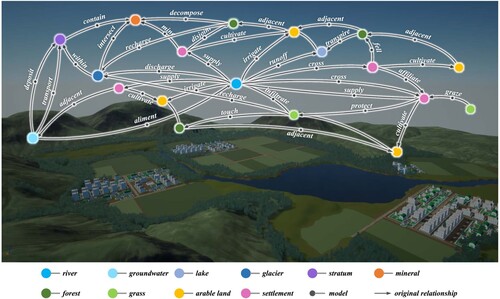
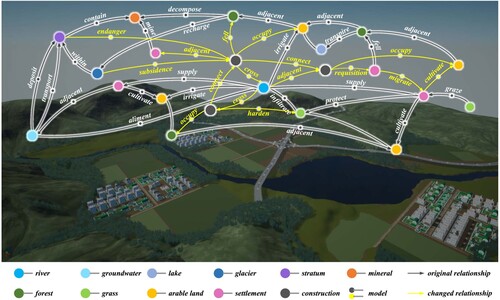
Figure 16. Changes of interactional relationships between natural resources due to human construction; relationships that changed during construction are colored in yellow.
Data availability statement
The data that support the findings of this study are openly available in Zenodo at https://doi.org/10.5281/zenodo.5715940, https://doi.org/10.5281/zenodo.6016580.