
Figures & data
Figure 1. Study area: (a) and (b) geographical location of the study area; (c) shaded relief map of the study area showing the geomorphic settings of this region; and (d), (e), and (f) Google Earth images of three typical landslides.
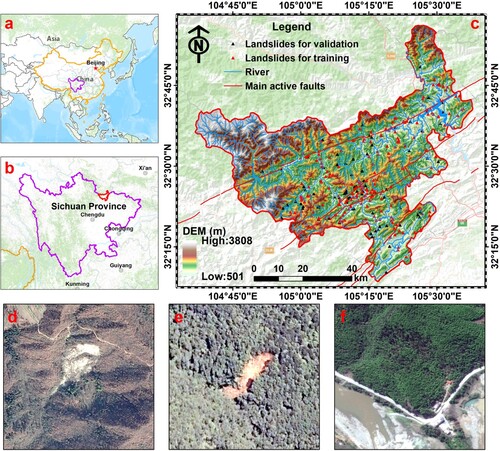
Figure 2. Fifteen landslide conditioning factors are utilized in LSM.
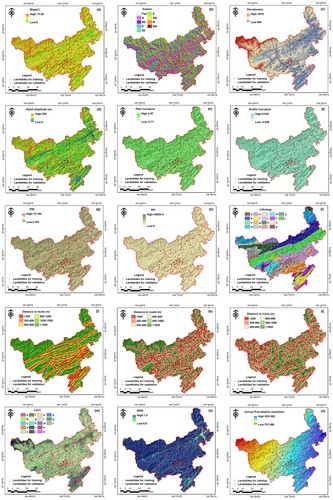
Table 1. Data utilized in the present study.
Table 2. Description of the lithology map and LULC map.
Figure 3. Workflow of the present study.
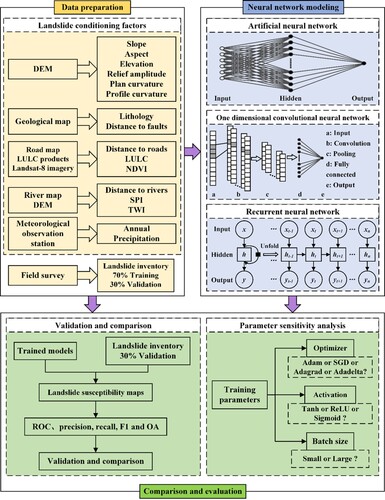
Figure 4. Architecture of a typical three-layer ANN. @15 represents the neurons in this layer are 15.
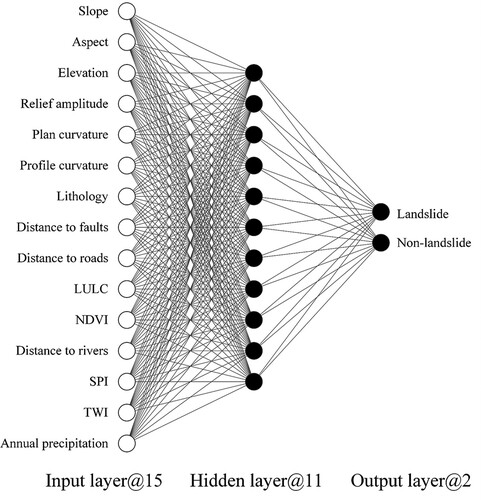
Figure 5. Architecture of 1D CNN.
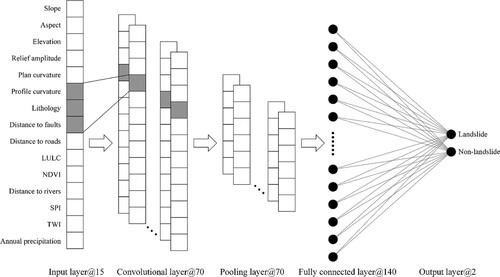
Figure 6. Architecture of a typical RNN.
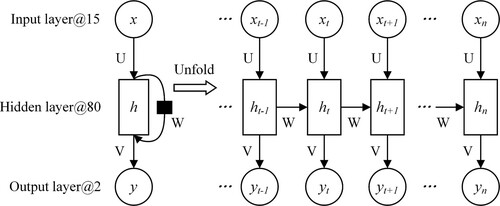
Figure 7. (a) Multicollinearity and (b) relative importance analysis of landslide conditioning factors.
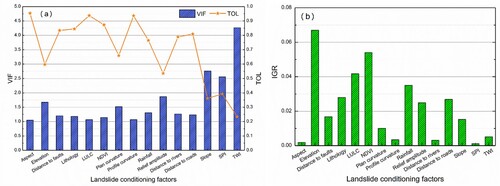
Figure 8. Selection of optimal model structure parameters for ANN, 1D CNN and RNN using tenfold cross-validation with the stratified sampling method.
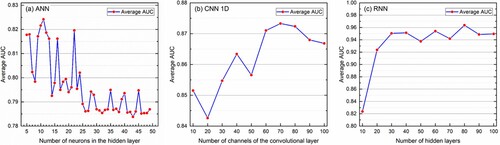
Table 3. Training hyper-parameter setting in this study.
Figure 9. Landslide susceptibility maps generated by three neural network models.
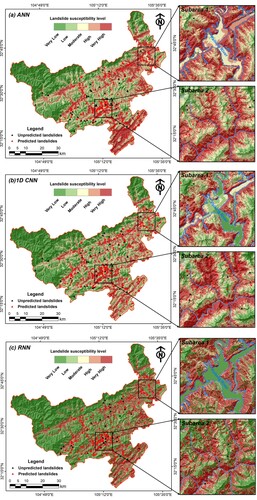
Table 4. Statistical analysis of different landslide susceptibility maps.
Figure 10. Comparison of the performance of neural network models: (a) ROC curves and (b) histogram of all accuracy evaluation measures.
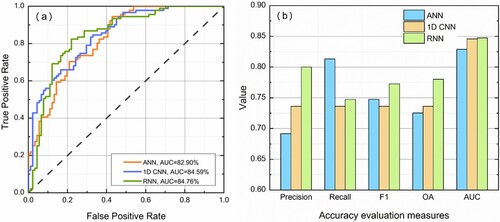
Table 5. Wilcoxon rank-sum statistical test (two-tailed) between different neural network models.
Figure 11. Predictive performance of different neural network models with different training hyper-parameter settings.
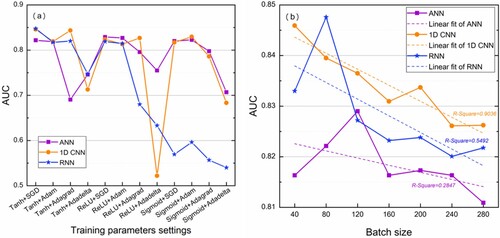
Table 6. Comparison of model complexity.
Data availability statement
The data or code used in this study are available from the corresponding author on reasonable request.