
Figures & data
Figure 1. The method of population mixture analysis. The NMF refers to the nonnegative matrix factorization algorithm and SSPP refers to the spatial-spectral preprocessing method.
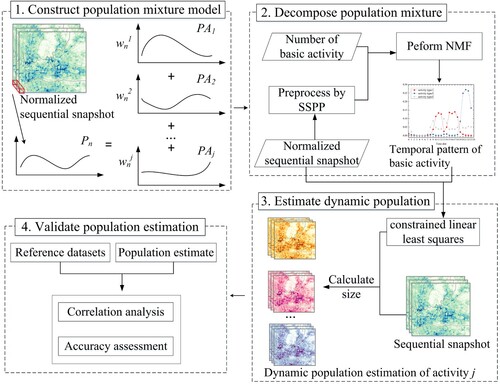
Figure 2. The geographical location of our study area. (a) the study area in China; (b) the study area in Guangdong Province; (c) the spatial distribution of the five central urban districts of Guangzhou including Haizhu, Yuexiu, Liwan, Tianhe, and Baiyun.
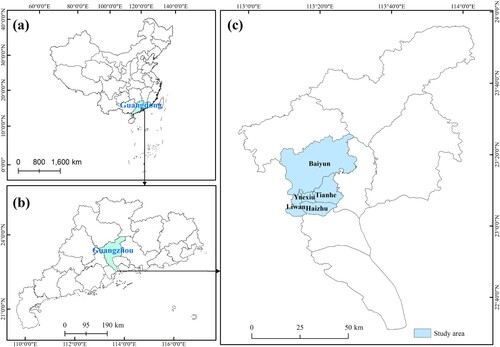
Figure 3. Averaged RTUD images at different times of weekdays in the study area.
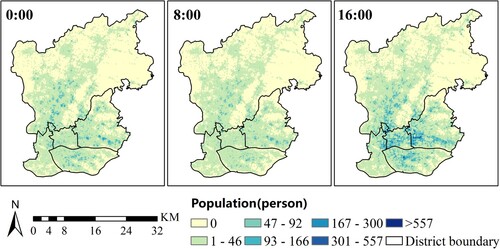
Figure 4. (a) Variation of RSS value with the number of basic activities. (b) Temporal patterns of three basic activities.
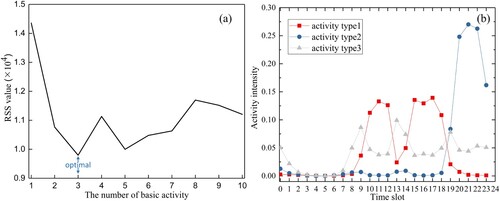
Table 1. Results for Spearman rank correlation analysis.
Figure 5. Work-to-household ratio estimation error distribution for each street. (a) Estimation error based on population decomposition, and (b) estimation error based on raw RTUD.
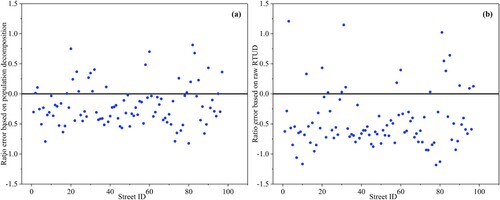
Figure 6. Scatterplots of reference work-to-household ratio and estimated work-to-household ratio based on (a) population decomposition and (b) raw RTUD.
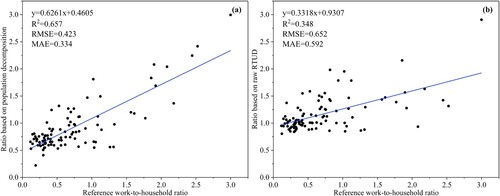
Figure 7. Temporal changes in population densities for different human activities in central districts of Guangzhou. (a) Working population, (b) Stay-at-home population and (c) Socializing population.
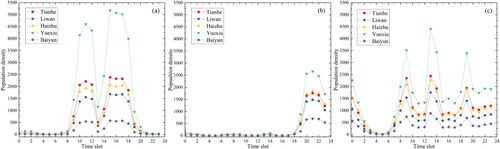
Figure 8. Dynamic spatial distributions of working population in the study area. ‘OB’ refers to official building, and regions OB1and OB2 are the office buildings around Tianhe Sports Center and Zhujiang New Town; ‘CS’ refers to commercial services, and regions CS1to CS5 correspond to Clothing market and trade city, International textile city, Clothing market, Mopark department store and Tianyu plaza, and International textile city.
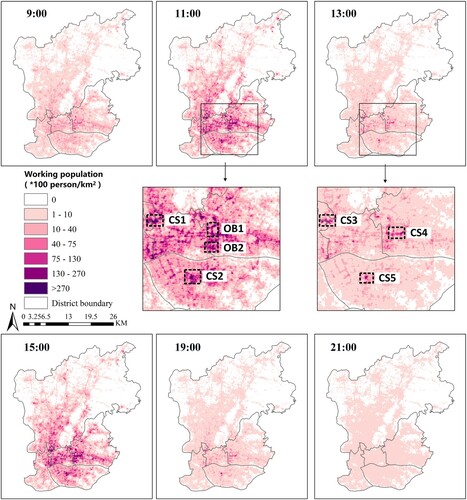
Figure 9. Spatial distributions of socializing population at different hours in the study area. ‘CTS’ refers to coach terminal station, and region CTS is Guangdong coach terminal station and Guangzhou railway station; ‘Hosp’ refers to the hospital, and region Hosp is Zhongshan ophthalmic center and Guangzhou women and children medical center; ‘SS’ refers to the subway stations, and regions SS1 and SS2 and the Ganging subway station and Kecun subway station; ‘BS’ refers to bus station, and region BS is Chebei bus station; ‘UV’ refers to urban villages, and areas UV1 to UV2 correspond to Kangle village and Shangyong village. ‘CE’ refers to the commercial and entertainment centers, and areas CE1 and CE2 are the Beijing road commercial pedestrian street and shopping malls of TaiKoo hui and Teemall.
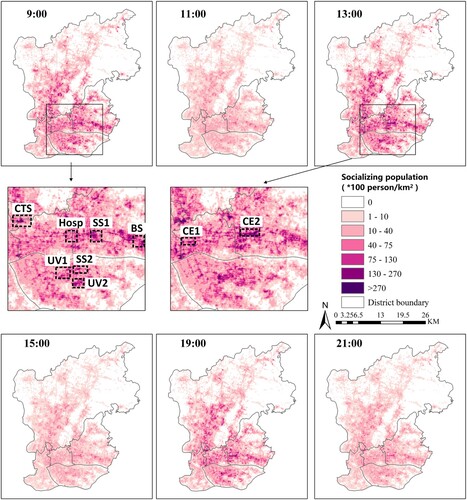
Figure 10. Dynamic distributions of the stay-at-home population in the study area. ‘RA’ refers to the residential areas, and regions RA1 and RA2 correspond to Caiyuan community and Jiayi garden; ‘UV’ refers to the urban village, and regions UV1 and UV2 are Tangdang village and Shangyong village.
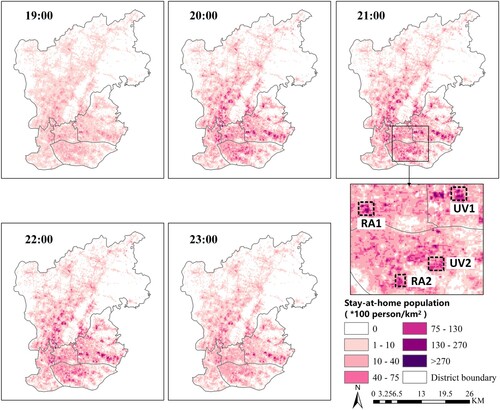
Figure 11. Satellite images of the three sample regions. (a1) Nanzhou garden with residential and commercial functions; (b1) Liying plaza with commerce, transportation, work and residence functions; (c1) the People's Municipal Government of Guangzhou with work function, and (a2-c2) are the hourly population of regions a1 to c1.
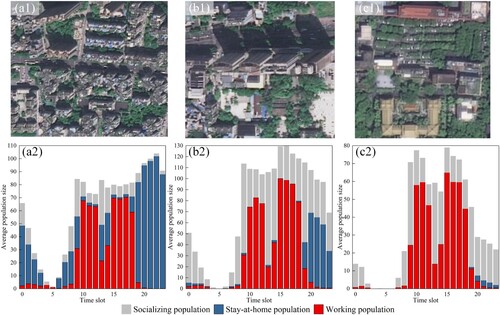
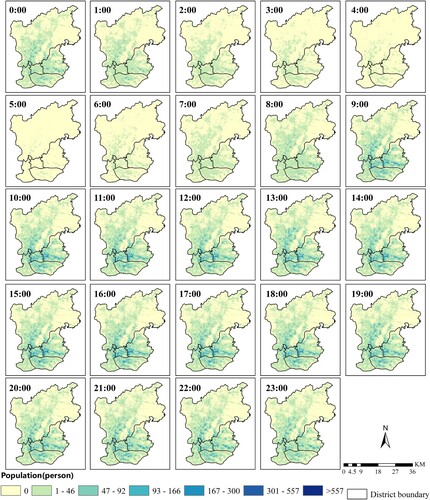
Figure A1. Averaged 24 h RTUD images of weekdays in the study area.
Data availability statement
We provided sample data and codes to make our research reproducible, accessed in GitHub (https://github.com/shiql/PopulationMixture).