
Figures & data
Figure 1. Data and study area. (a) The location distribution of street view images. (b) Street view distribution near the SOGO Department Store and example of street view panorama. (c) The process of generating perspective images from the panorama.
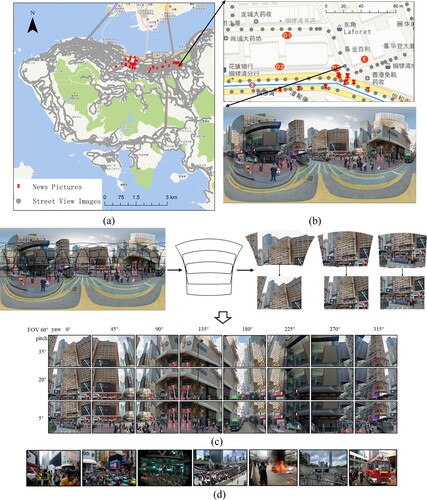
Figure 2. Example of query images.
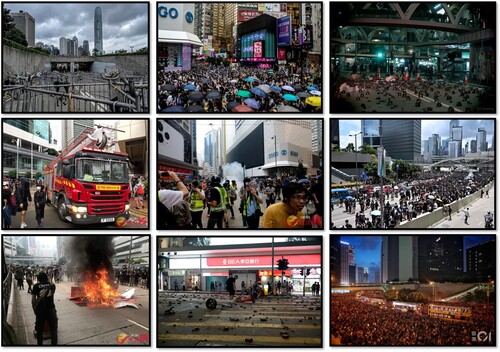
Figure 3. Google Landmarks Dataset.
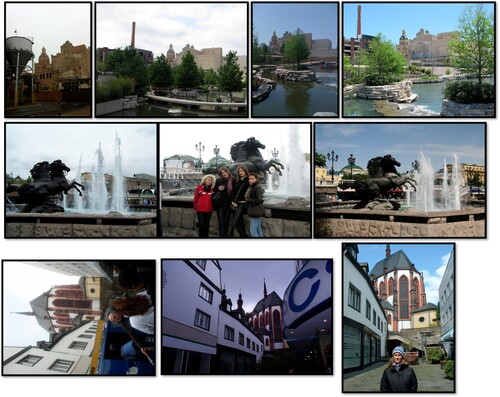
Figure 4. The architecture of pipeline for news picture geo-localization.
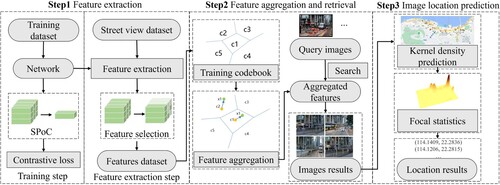
Figure 5. The network architecture for retrieval in the training and feature extraction steps.
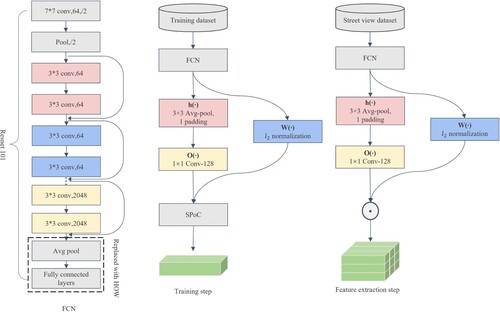
Figure 6. Loss of feature extraction network.
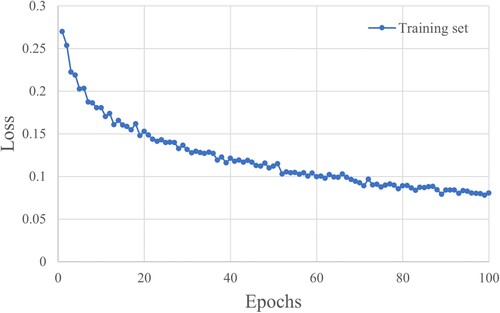
Figure 7. The tuple input of the network and contrastive loss.
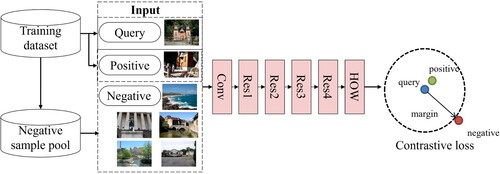
Figure 8. The KDP process of the example image.
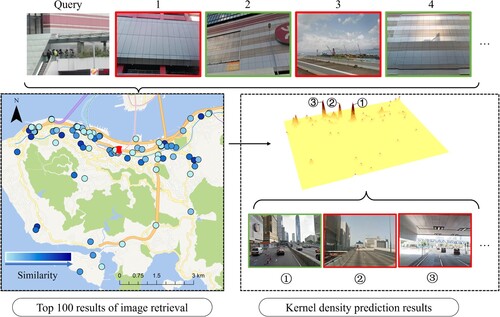
Table 1. Results of the proposed pipeline.
Figure 9. The subexperimental area and dataset.
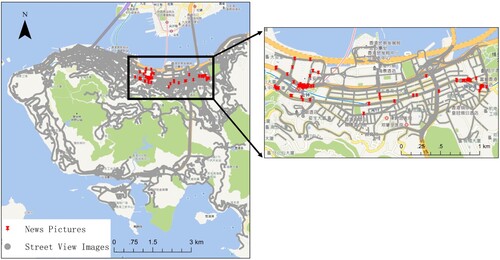
Table 2. The subexperimental results of this paper pipeline.
Figure 10. The improvement of ED between both methods.
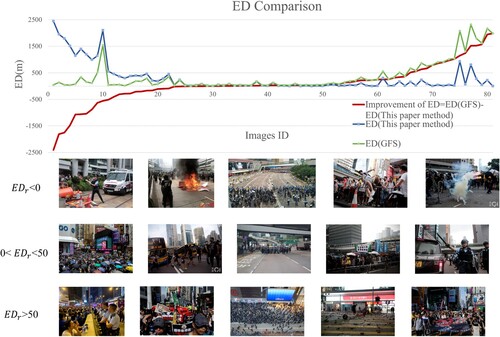
Table 3. The subexperimental results of the GFS method.
Table 4. The subexperimental results of the GeM method.
Table 5. The subexperimental results of the NetVLAD method.
Table 6. The statistics of subexperimental ED results of comparison.
Figure 11. The example of attention layer visualization of news images on different scales.
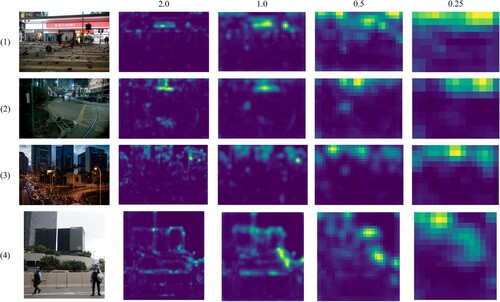
Table 7. Results of the retrieval method.
Figure 12. Results in the different kernel density radii.
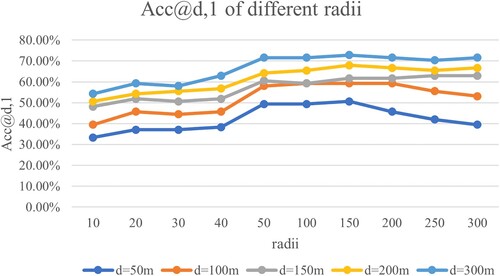
Figure 13. The Top 1 positive result samples of query images.
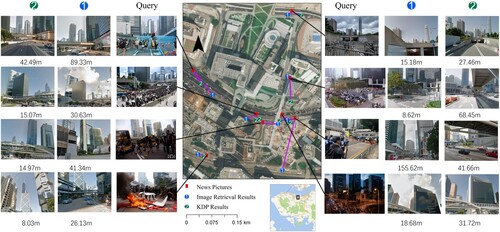
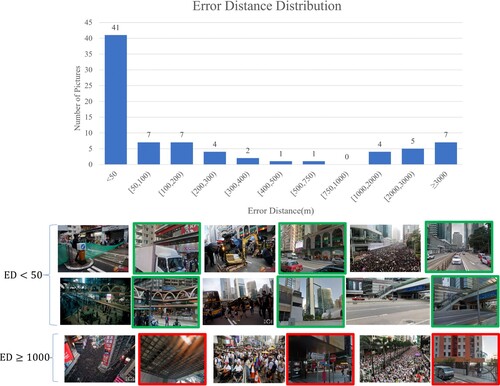
Figure 14. The distribution of KDP Top 1 ED and corresponding image retrieval Top 1 example results.
Data availability statement
The data that support the findings of this study are available from the corresponding author upon reasonable request.