
Figures & data
Figure 1. Geographical location and topographic characteristics of the Sichuan-Tibet Railway and the mountain glaciers along the railway.
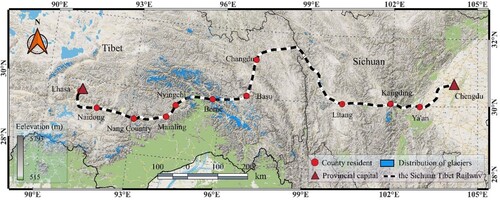
Figure 2. Distribution of glaciers.
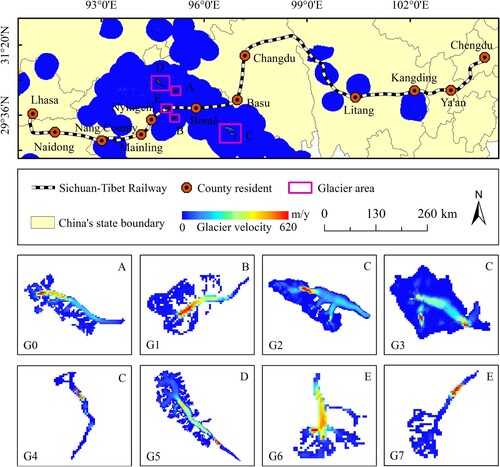
Figure 3. Annual average velocities of glaciers from 1988 to 2018.
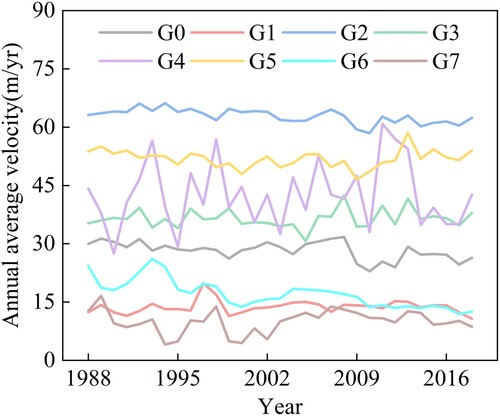
Table 1. Properties of glaciers.
Figure 4. Wavelet variance of time series velocities in typical mountain glacier areas.
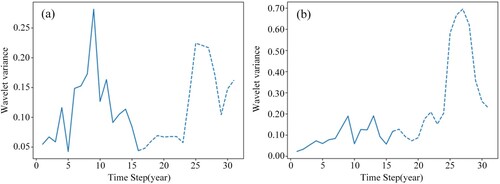
Figure 5. ConvGRU network structure.
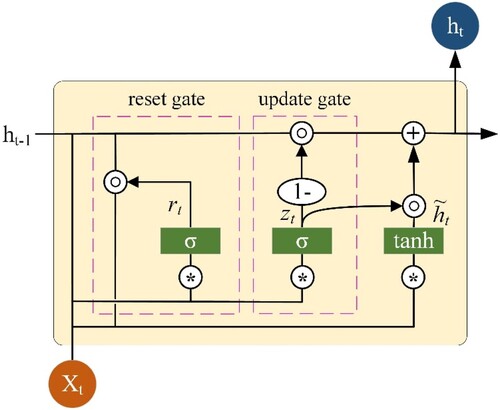
Figure 6. Neural network model based on ConvGRU.
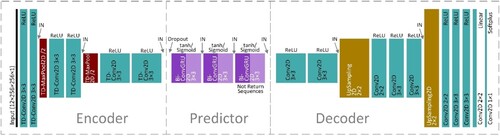
Table 2. Basic system platform configurations.
Table 3. Important software (package) configurations.
Figure 7. Metric changes of G2 and G5 during training.
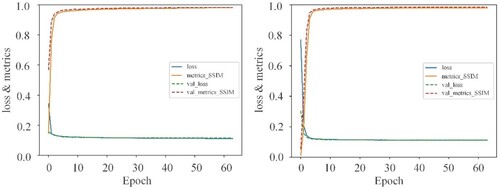
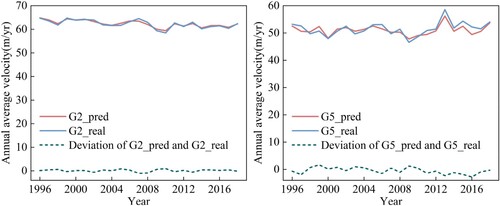
Figure 8. Prediction results of time series velocities of G2.
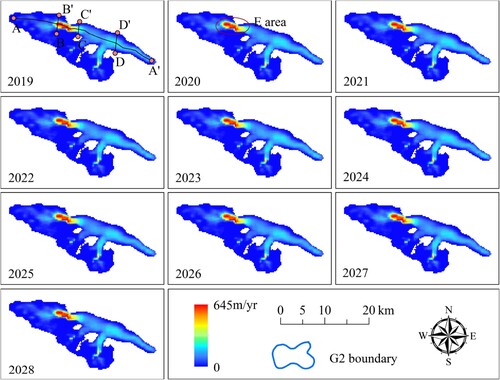
Figure 9. Prediction results of time series velocities of G5.
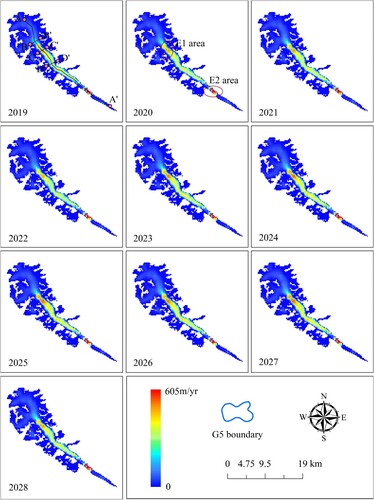
Figure 10. Velocities of the mainstream line (AA’) of typical mountain glaciers in elevation and slope.
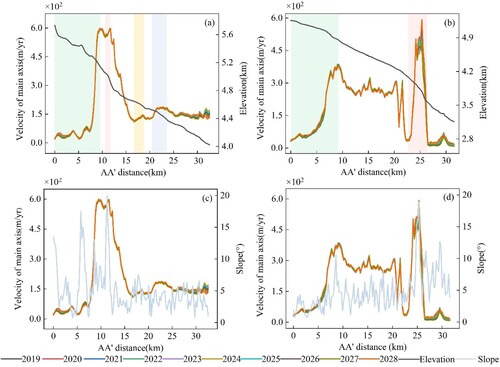
Figure 11. Velocities of cross-section lines (BB’, CC’ and DD’) of typical mountain glaciers.
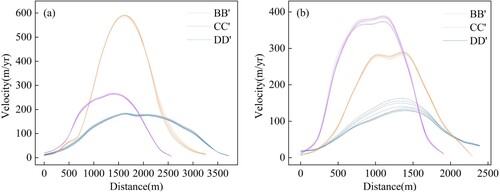
Figure 12. Comparison of the real values and the predicted values.
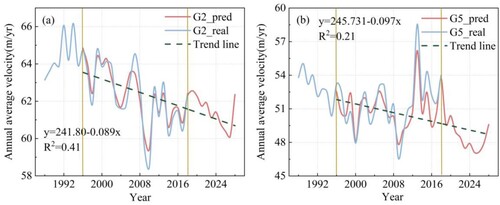
Table 4. Evaluation indexes.
Figure 13. Deviations between the real values and the predicted values.
Data availability statement
The data that support the findings of this study are available from the corresponding author upon reasonable request.