
Figures & data
Figure 1. Illustrating the assessment (a, b, c, and d) and evaluation (e and f) approaches with schematic maps.
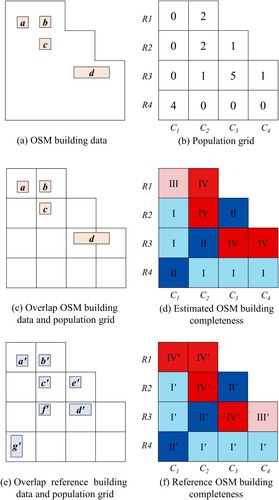
Table 1. The confusion matrix for comparing between estimated and reference OSM building completeness*.
Table 2. A description of reference building data.
Figure 2. The estimated OSM building completeness of 12,975 cities worldwide, in terms of (a) city scale and (b) national scale.
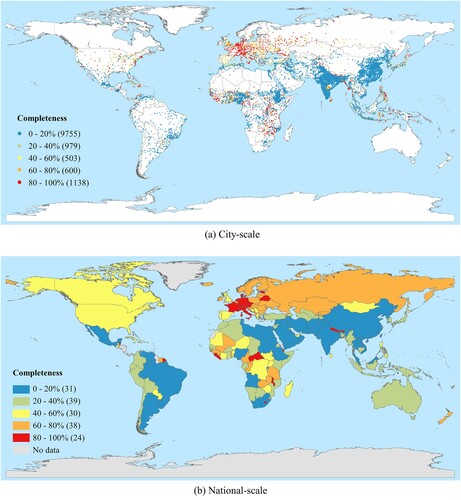
Figure 3. The estimated OSM building completeness of 15 typical cities worldwide.
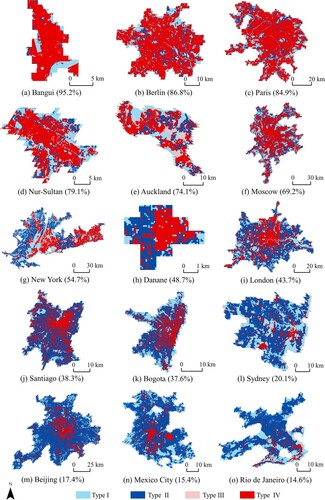
Figure 4. Relationships between estimated and reference OSM building completeness values for eight different countries.
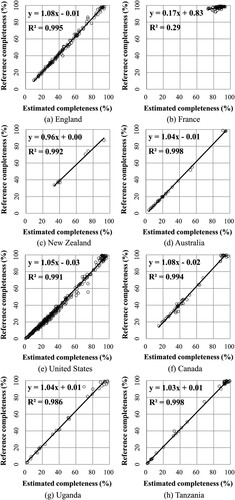
Figure 5. Distributions of the difference between estimated and reference OSM building completeness for eight different countries.
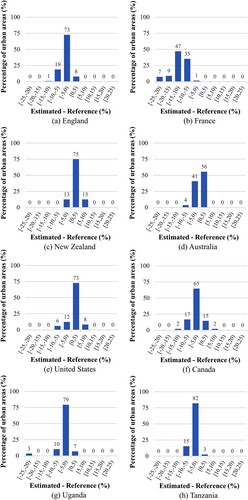
Figure 6. Confusion matrixes for eight different countries.
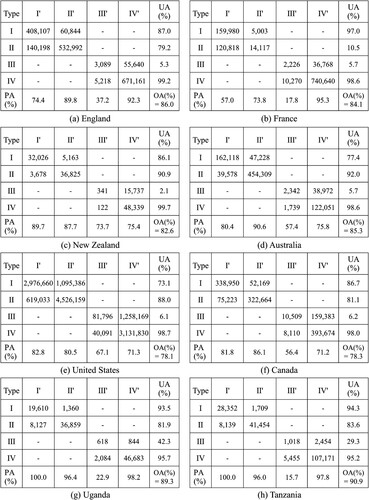
Figure 7. Illustrating the reasons for the low accuracy of Type III, by comparing (a, b) Google Earth images, (c, d) OpenStreetMap (OSM) building data, (e, f) reference building data, and (g, h) population grid data.
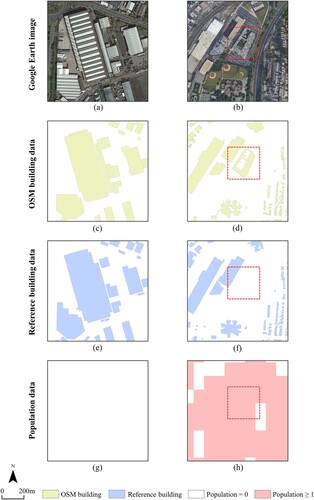
Figure 8. Relationship between the number of sampled grid cells and overall accuracy.
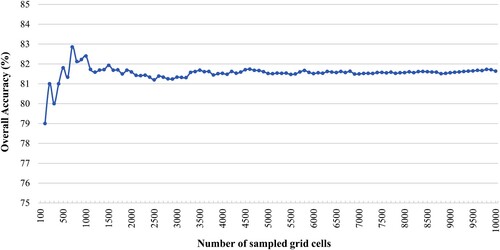
Table 3. Confusion matrixes for 10,000 sampled grid cells globally.
Figure 9. Illustrating the flaw of using the count ratio for assessing OSM building completeness.
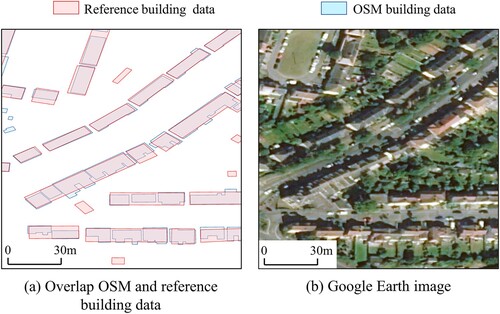
Table 4. Relationships between the estimated and reference OSM building completeness using the area ratio and count ratio.
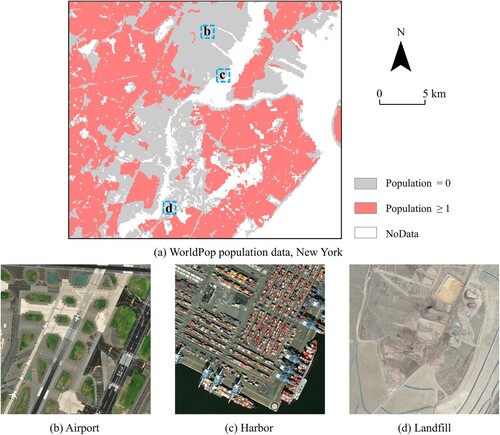
Figure 10. Flaws of using a smaller threshold (zero) for the population count. “NoData” represents areas that were mapped as unsettled (Bondarenko et al. Citation2020).
Data availability
The data that support the findings of this study are openly available in figshare at https://figshare.com/s/8d4d92388cff90ed7f9f.