Figures & data
Figure 1. Geographical distribution of the sample lakes in this study.
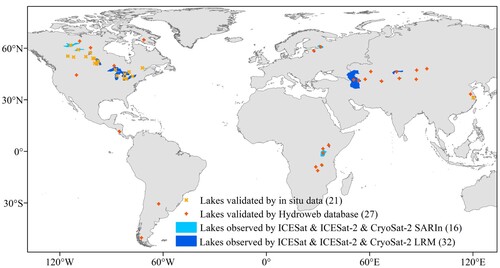
Table 1. Satellite basic parameters.
Figure 2. Flowchart of deriving the time series of lake water level by synthesizing multiple satellite altimetry data.
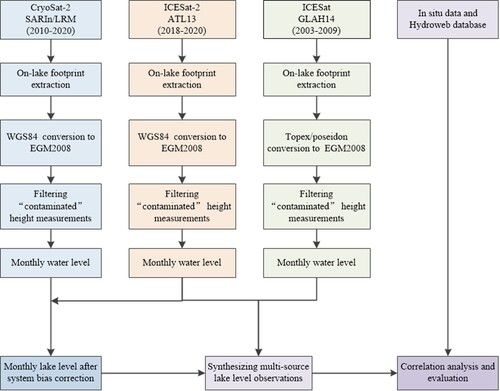
Figure 3. Data difference between ICESat and ICESat-2 in relation to location latitude (a) and lake area (b).
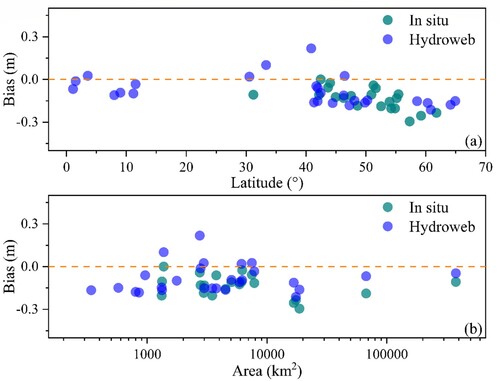
Figure 4. Pairing results for CryoSat-2 and ICESat-2 in Lake Ontario.
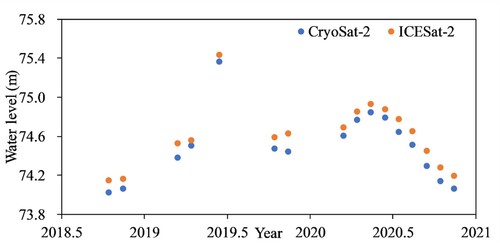
Figure 5. Relationship between CryoSat-2 systematic deviation and (a) location latitude; (b) lake area; and (c) the number of pairs.
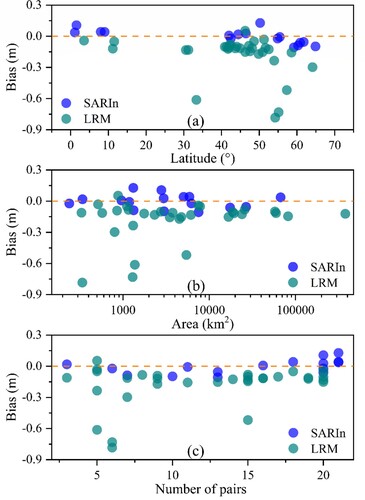
Figure 6. Comparison of lake water levels derived from satellite altimetry data and in situ measurements for Ontario Lake during 2003–2020. Water level time series (a); ICESat (b), ICESat-2 (c), CryoSat-2 (d), ICESat & ICESat-2 & CryoSat-2 (e).
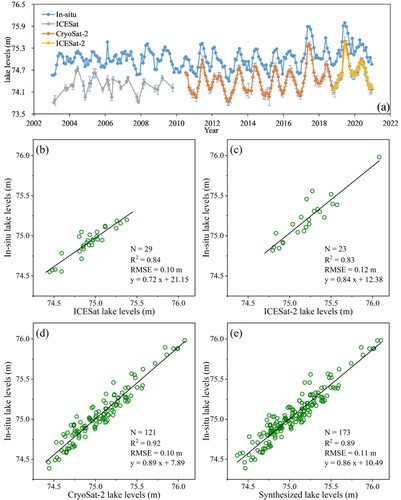
Figure 7. Box plot representing R2 and RMSE of satellite and validation data (gauge station and Hydroweb data).
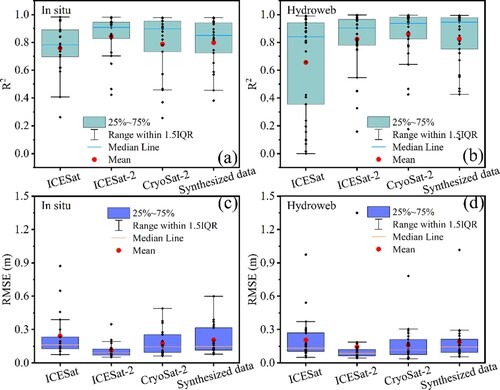
Figure 8. Box plot representing R2 and RMSE of synthesized data (using CryoSat-2 SARIn and LRM modes, respectively) and validation data.
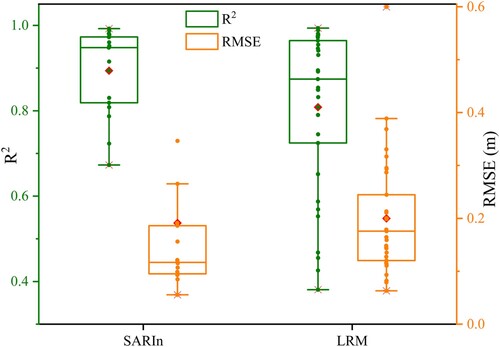
Figure 9. R2 and RMSE of synthesized and validation data versus the number of CryoSat-2 and ICESat-2 pairs.
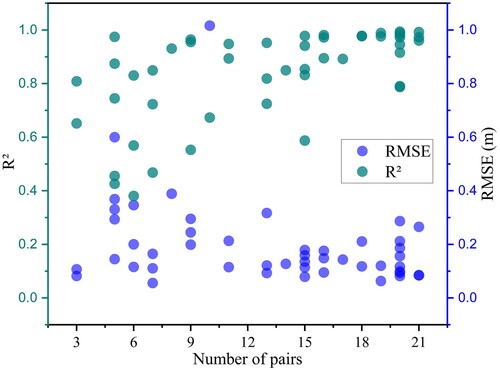
Figure 10. Scatter plot of lake level change rates between the validation and synthesized data.
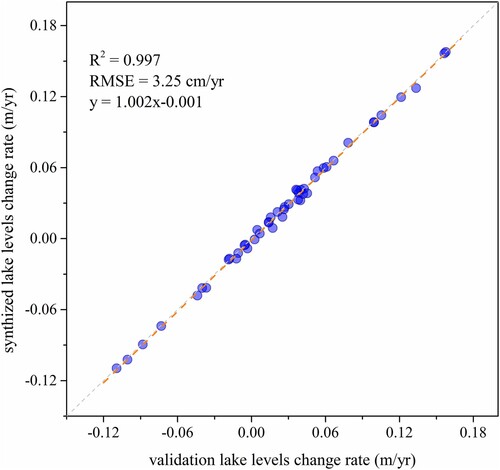
Figure 11. R2 (a) and RMSE (b) of the joint satellite and validation data are obtained by three different correction methods: Method-1 (Month paired), Method-2 (Fitting), and Method-3 (No pairing).
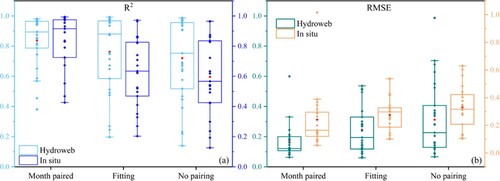
Figure 12. Systematic deviations of CryoSat-2 relative to ICESat-2 calculated for different matching times.
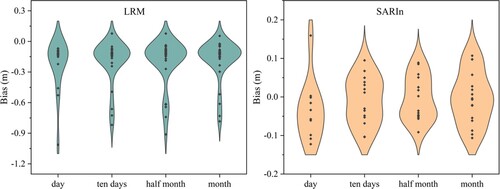
Figure 13. Systematic bias of CryoSat-2 data for different matching time windows.
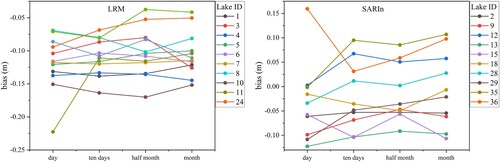
Figure 14. Coverage of global lakes by different satellites.
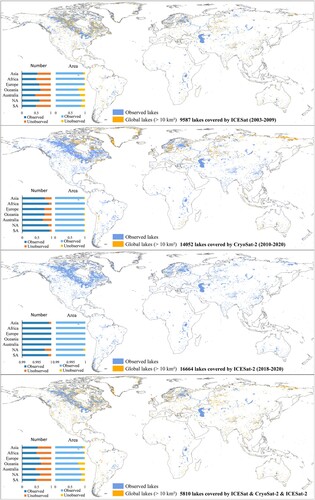
Figure 15. Relationship between the number of pairs of CryoSat-2 and ICESat-2 and the lake area.
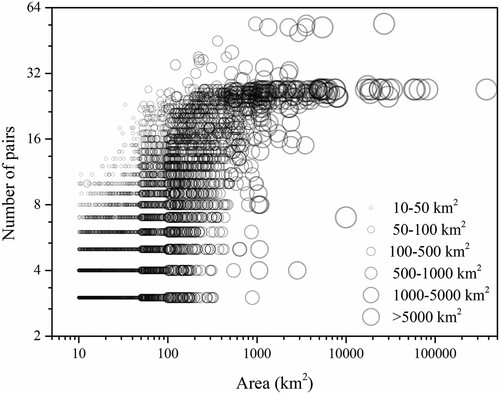
Table A1. Information for study lakes.
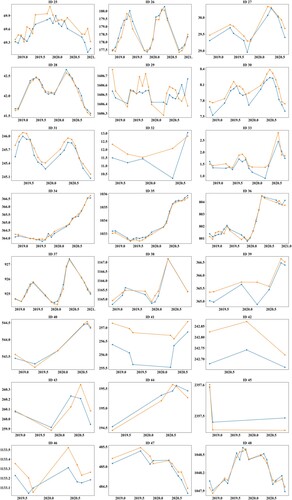
Figure A1. Water level time series obtained from synthesized data and validation data for lakes 1 to 48.
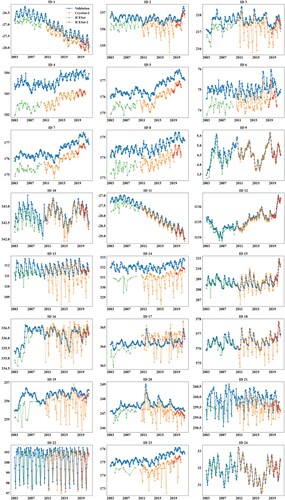
Figure A1. Continued
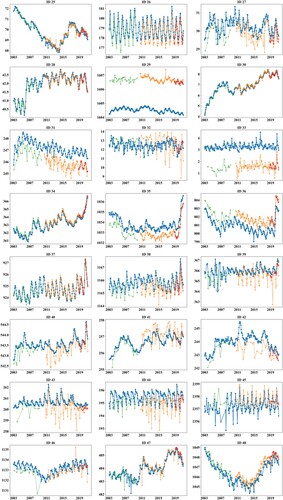
Figure A2. CryoSat-2 and ICESat-2 pairs data for lakes 1 to 48.
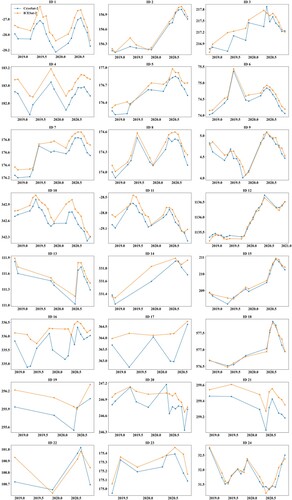
Figure A2. Continued