
Figures & data
Figure 1. Point data: (a1–f1) Top views of the point clouds in sections 1–6. (a2–f2) The side view of point clouds in sections 1–6. (g1) Different types of power towers. (g2) Telegraph poles. (h) Different types of power lines (cross-section of bundled lines in the red box).
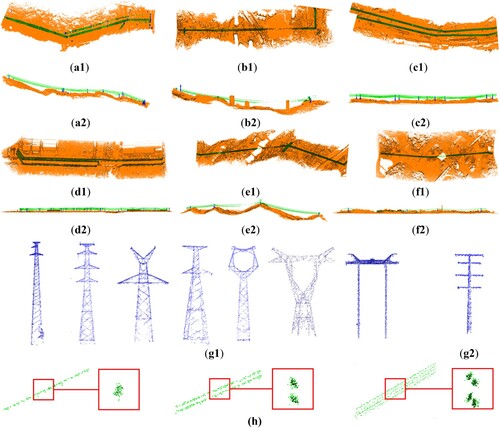
Table 1. Data details.
Figure 2. Different densities of point clouds: The average densities of (a–d) are 45.8, 21.5, 9.4 and 4.5 pts/m2, respectively. The average densities of (e–h) are 30.6, 13.1, 5.8 and 1.9 pts/m2, respectively (the red lines show the basic shape and structure of the objects).
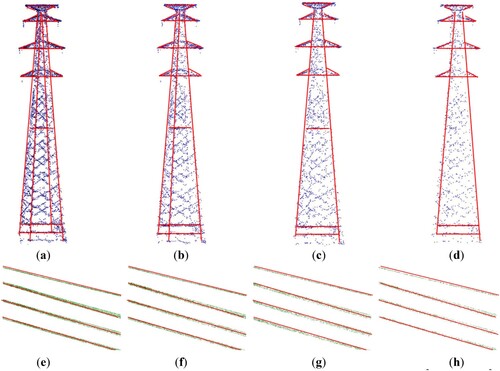
Figure 3. The density characteristics of point clouds (rotating a block of the point clouds along the direction of the structural points).
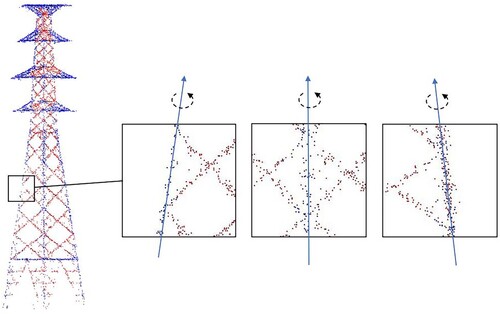
Figure 4. The flowchart of the segmentation method.
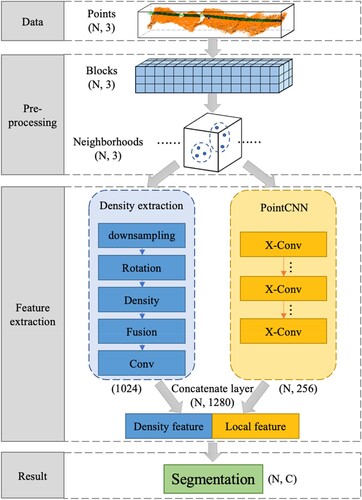
Figure 5. The limitations of the KNN algorithm in the local area.
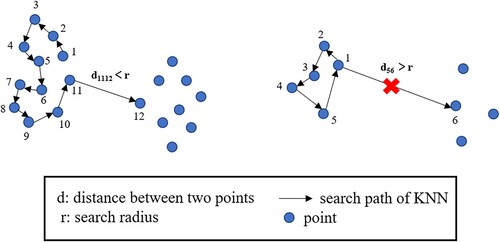
Figure 6. The flow of data preprocessing: (a) Data blocking. (b) Construction of the neighbourhood system. (c) Neighbourhoods in structural and unstructured point clouds.
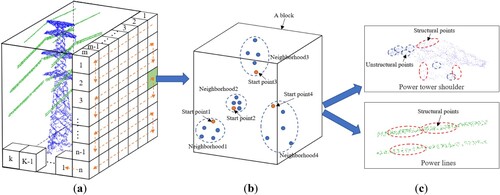
Figure 7. Extraction process of density features.
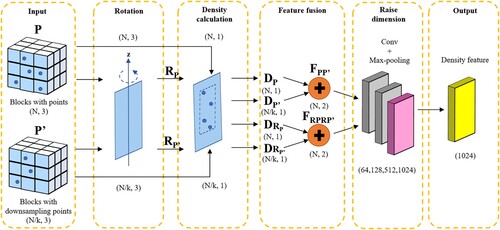
Figure 8. Density calculation method: (a) Build a 3D plane and project the point clouds. (b) The area of the minimum circumscribed rectangle between the plane point clouds and the projection point clouds is the range of density calculation.
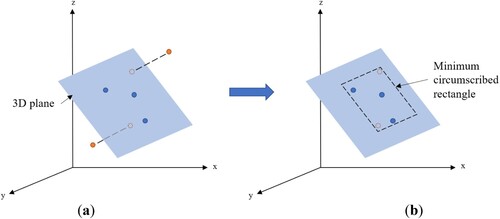
Figure 9. Two feature fusion methods: (a) Feature interpolation based on the distance between adjacent point clouds. (b) Direct mapping method for feature fusion.
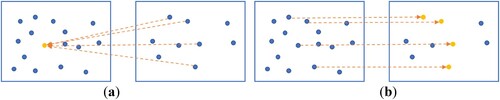
Figure 10. The flow of point segmentation.
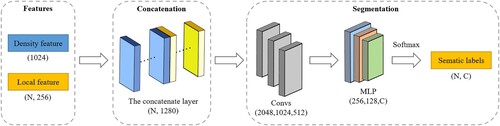
Figure 11. The schematic diagram of blocks and neighbourhoods.
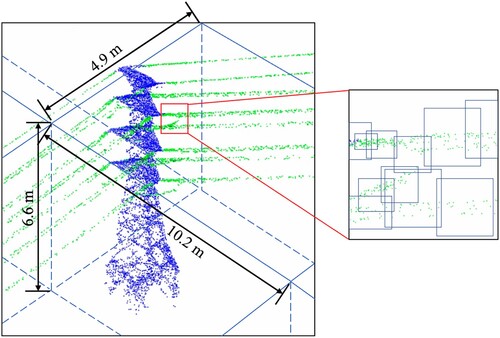
Table 2. Blocking details.
Figure 12. The segmentation results of the power line and power tower point clouds: (a) Ground truth of No.5’s point clouds. (b) The results of No.5’s point clouds. (c) Ground truth of No.6’s point clouds. (d) The results of No.6’s point clouds. Green point clouds are power lines, blue point clouds are power towers and grey point clouds are other classes.
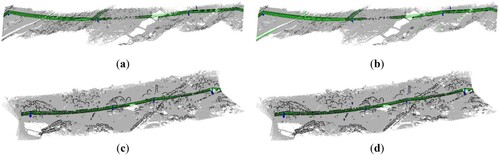
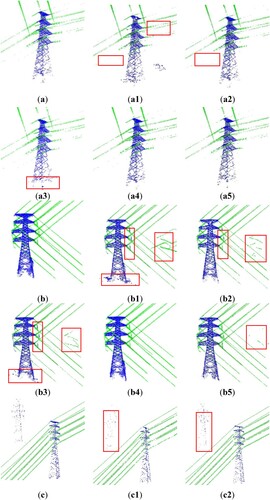
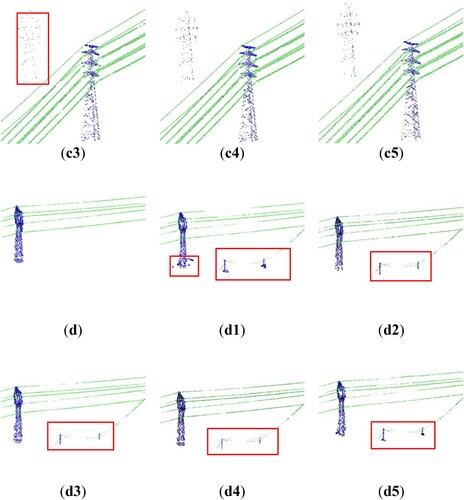
Figure 14. The trends of indicators for evaluating segmentation: (a) The trend of the mean IoU. (a2) The trend of the overall accuracy.
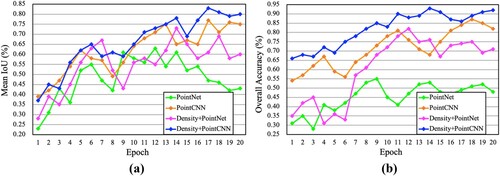
Table 3. Segmentation evaluation of different methods.
Figure 15. The point clouds at different densities: (a) the original density; (b) 1/5th of the original density; (c) 1/10th of the original density; (d) 1/20th of the original density. Green point clouds are power lines, and blue point clouds are power towers.
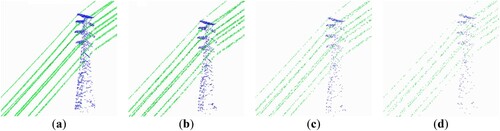
Figure 16. The segmentation results at different densities (using the D + L mode): (a,e) the ground truth; (b,f) 1/5th of the original density; (c,g) 1/10th of the original density; (d,h) 1/20th of the original density. Green point clouds are power lines, and blue point clouds are power towers.
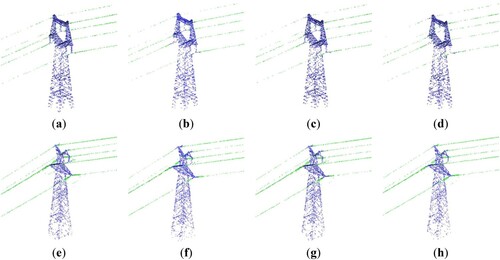
Table 4. Segmentation evaluation of different downsampling degrees (using D+L mode).
Figure 17. The echo intensity of point clouds.
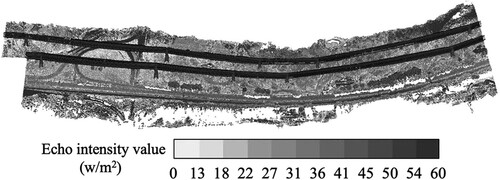
Figure 18. The influence of echo intensity on the segmentation results (using D + L mode): (a,d) the ground truth; (b,e) model without echo intensity; (c,f) model with echo intensity. Green point clouds are power lines, and blue point clouds are power towers.
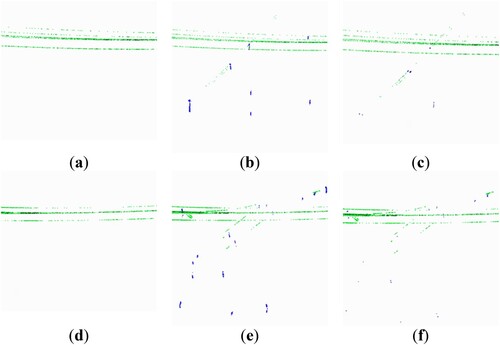
Figure 19. The effect of echo intensity on model training time (using the D + L mode).
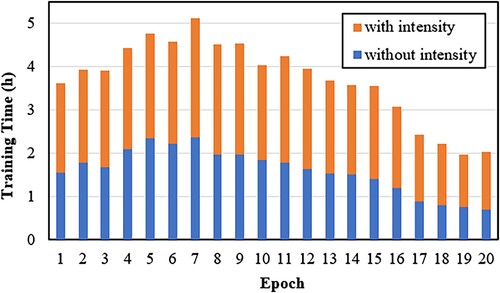
Table 5. Evaluation of the influence of echo intensity on segmentation (using the D + L mode).
Data availability statement
The test point data used in this study are openly available in the Dryad Digital Repository at https://doi.org/10.5061/dryad.j3tx95xj1.