
Figures & data
Figure 1. The study area in Beijing and the segregation of traffic analysis zones. Abbreviations of places: CDG – Chedaogou, CQ – Caoqiao, GM – Guomao, JRS – Jinrong Street, OFP – Olympic Forest Park, PKU – Peking University, SP – the Summer Palace, TH – Temple of Heaven, THU – Tsinghua University, ZGC – Zhongguancun.
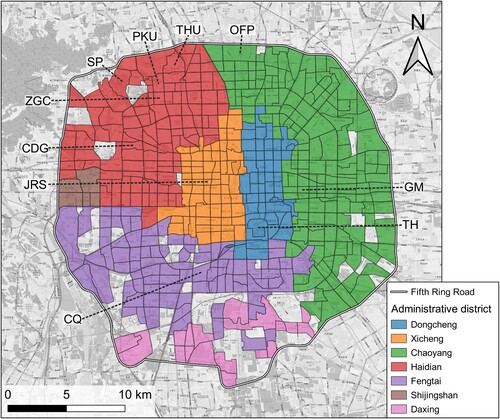
Figure 2. The flowchart of the proposed approach.
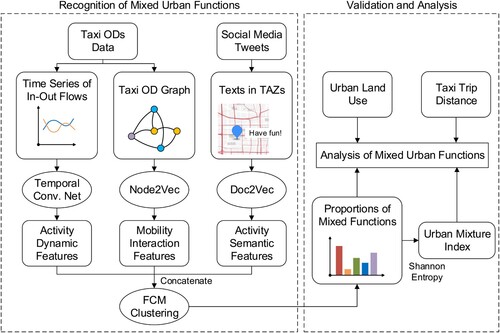
Figure 3. The dimensionality reduction of three feature embeddings, (a) activity dynamic features, (b) mobility interaction features, (c) activity semantic features. See for the abbreviations of the places.
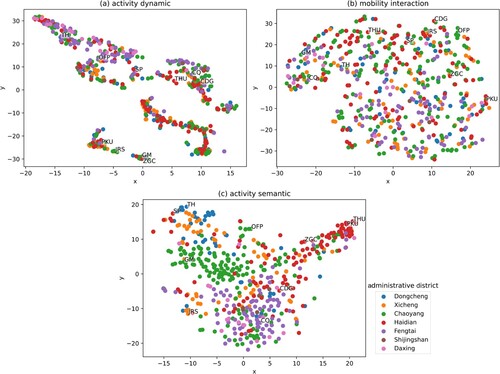
Figure 4. The change of average values and min-max intervals of fuzzy partition coefficient and silhouette score with the increases of cluster number K.
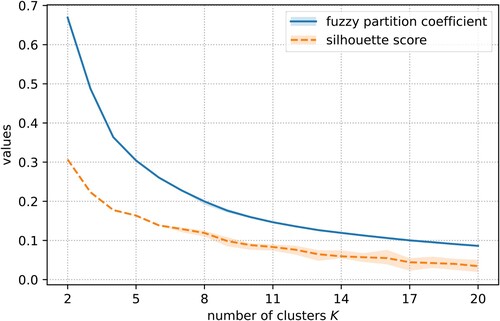
Figure 5. The Pearson’s correlation coefficients between the proportions of urban functions and land use types. *, **, *** denote p < 0.1, 0.01, 0.001, respectively.
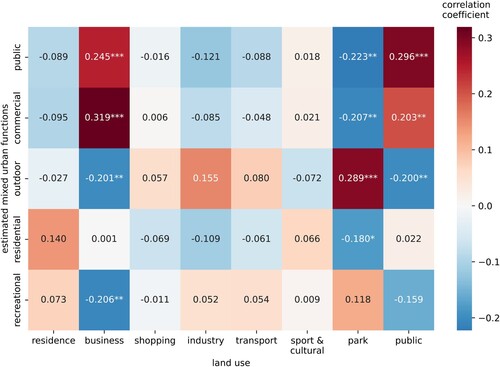
Figure 6. The spatial distribution of mixed urban functions. (a–e) the proportions of five urban functions, (a) public, (b) commercial, (c) outdoor, (d) residential, (e) recreational. (f) the dominant urban function in each zone.
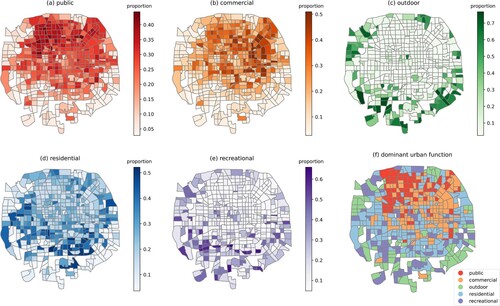
Figure 7. The spatial distribution of mixture index.
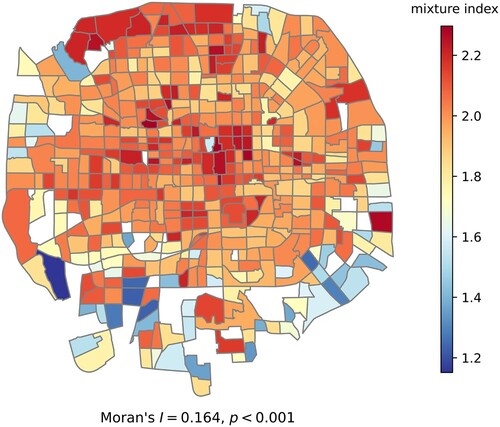
Figure 8. The Pearson’s correlation coefficients between urban function clusters and land use types, using only one human activity feature, (a) activity dynamic features, (b) mobility interaction features, (c) activity semantic features. *, **, *** denote p < 0.1, 0.01, 0.001, respectively.
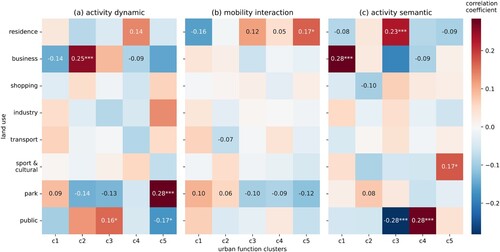
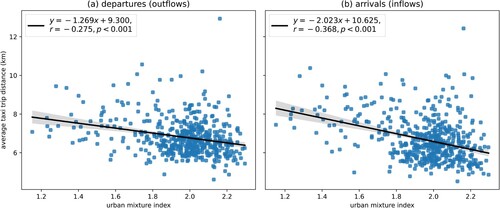
Figure 9. The linear regression between mixture index and average taxi trip distance, (a) departure (outflow) distance, (b) arrival (inflow) distance. The translucent bands denote 0.95 confidence intervals.
Data availability statement
The Weibo tweet data can be obtained from https://open.weibo.com/. The EULUC-China map data can be obtained from http://data.ess.tsinghua.edu.cn/. The Didi taxi OD data are available from the corresponding author upon reasonable request.