Figures & data
Figure 1. Study area scope and elevation.
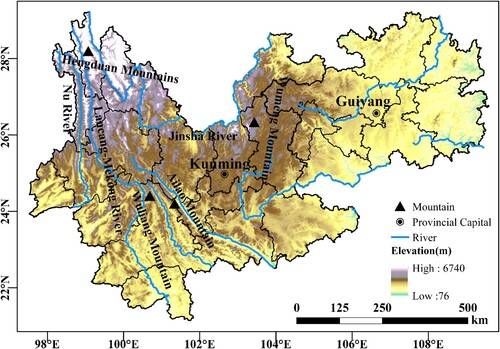
Table 1. Categories of trend significance for Mann-Kendall test.
Table 2. Types of interaction between two different driving factors.
Figure 2. (a) Spatial distribution and (b) change trend of annual averaged DSR over the YKP from 1984 to 2018.
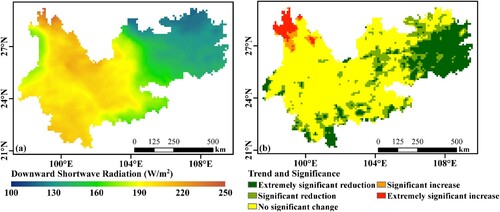
Figure 3. Trends in mean values of annual averaged DSR over the YKP from 1984 to 2018.
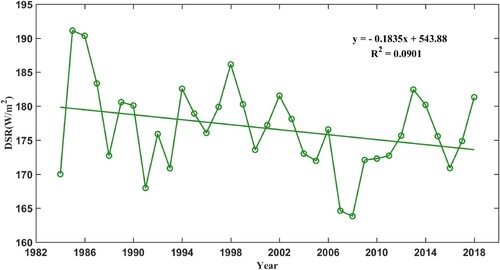
Figure 4. The spatial distribution and variability trends of seasonal averaged DSR over the YKP from 1984 to 2018.
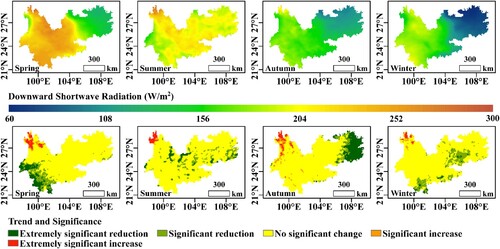
Figure 5. Trends in mean values of seasonal averaged DSR over the YKP from 1984 to 2018.
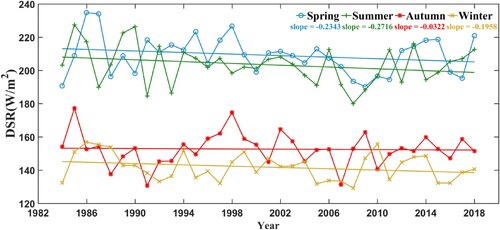
Figure 6. The spatial distribution of monthly averaged DSR over the YKP from 1984 to 2018.
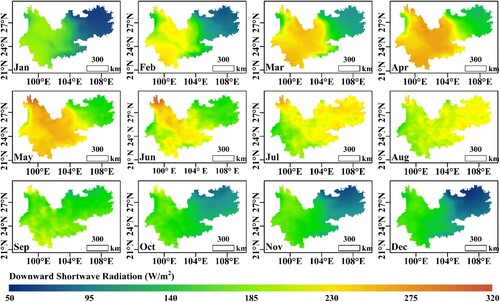
Figure 7. The change trend of monthly averaged DSR over the YKP from 1984 to 2018.
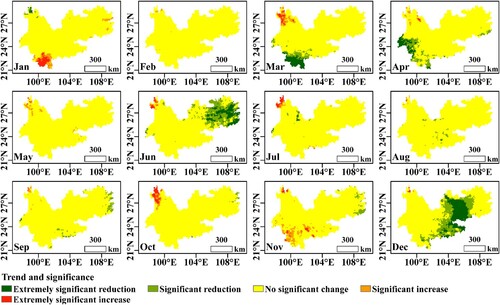
Figure 8. Trends in mean values of monthly averaged DSR over the YKP from 1984 to 2018, where the 12 months are shown separately by four seasons.
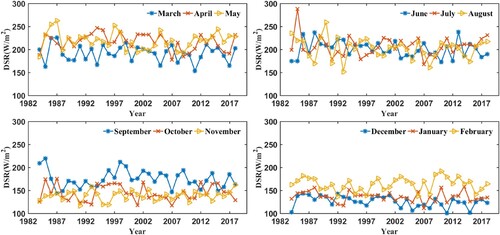
Figure 9. Detecting structural changes in both trend and seasonal components of daily averaged DSR over the YKP from 1984 to 2018. The dashed lines represent the breakpoint occurred, and the date of the breakpoint is marked by Julius Day and year.
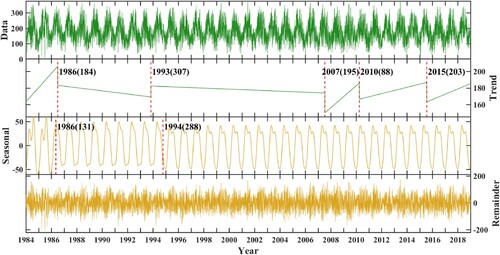
Figure 10. Interannual variations of q values of driving factors on the spatial heterogeneity of DSR over the YKP from 1984 to 2018.
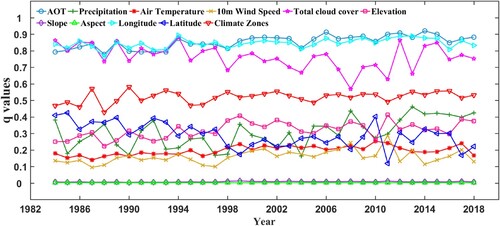
Figure 11. Risk detector of driving factors for spatial heterogeneity of DSR over the YKP from 1984 to 2018. The x-coordinate axis is the rank classification of the impact factors, and the y-coordinate axis is the averaged DSR of a factor category.
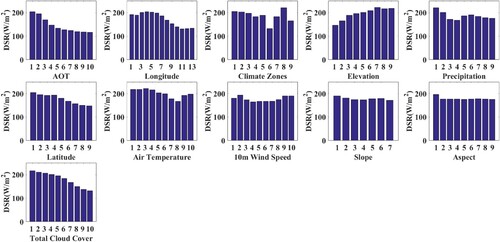
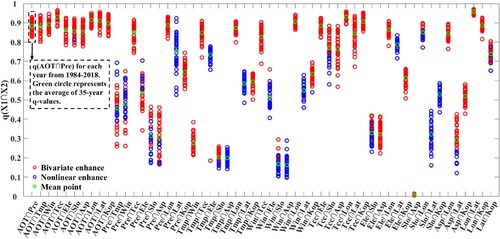
Figure 12. Interaction Detection of driving factors for DSR heterogeneity over the YKP from 1984 to 2018. X-coordinate axis is X1∩X2. Y-coordinate axis is q(X1∩X2).