
Figures & data
Figure 1. Experimental area.
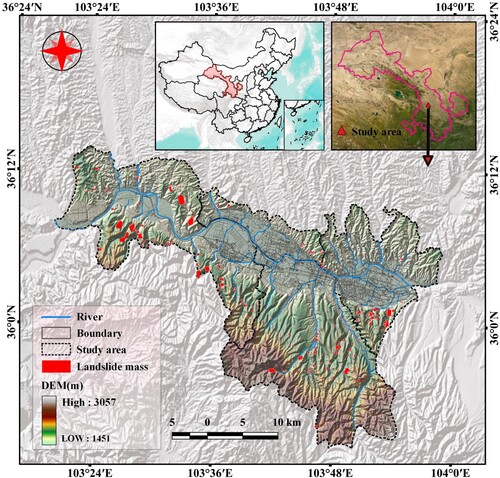
Table 1. Sentinel 2A satellite sensor parameters.
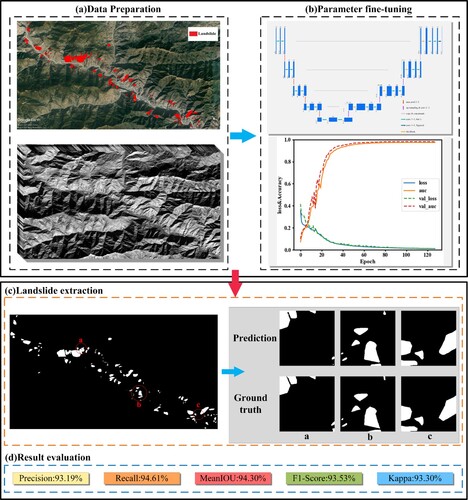
Figure 2. Landslide extraction flowchart.
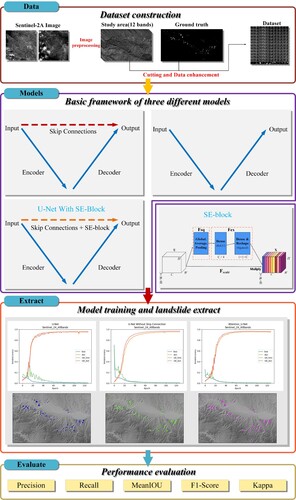
Figure 3. Sample of the partial dataset (12 bands, ground truth). (a) Image of a band of Sentinel-2A in the study area (band 8, the yellow rectangle represents the position of the part of the subimages obtained after cutting, with the number corresponding to that in b), (b) Subimages obtained after cutting (12 bands, ground truth).
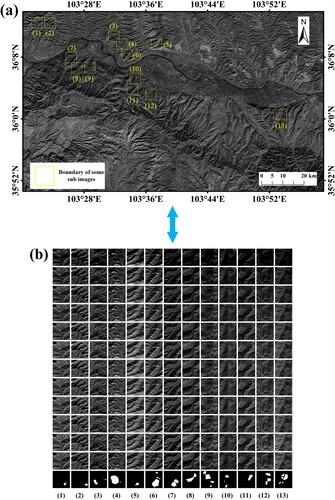
Figure 4. U-Net network structure.
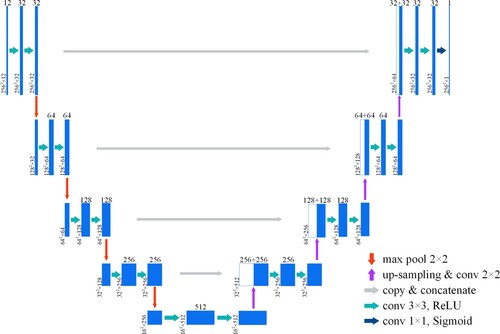
Figure 5. U-Net Backbone network structure.
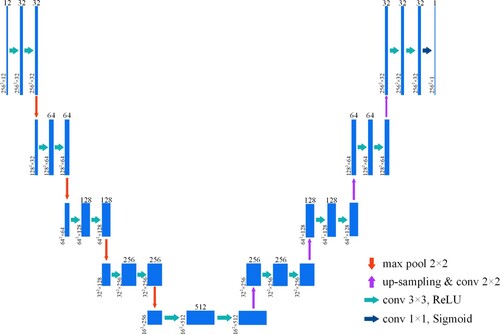
Figure 6. Squeeze-and-Excitation block (SE-block).
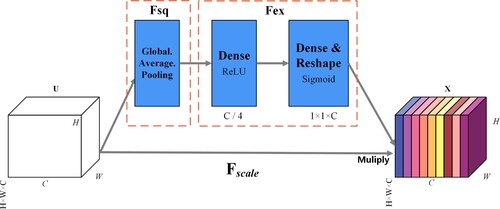
Figure 7. Improved attention U-Net network structure.
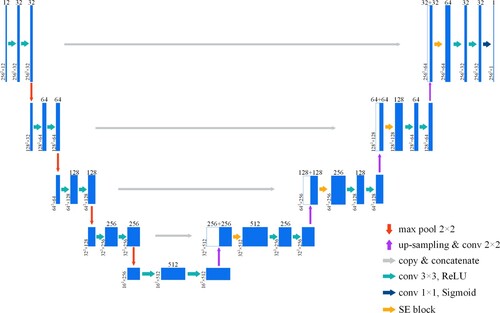
Table 2. Basic system platform configuration.
Table 3. The core software configuration.
Figure 8. Confusion matrix diagram.
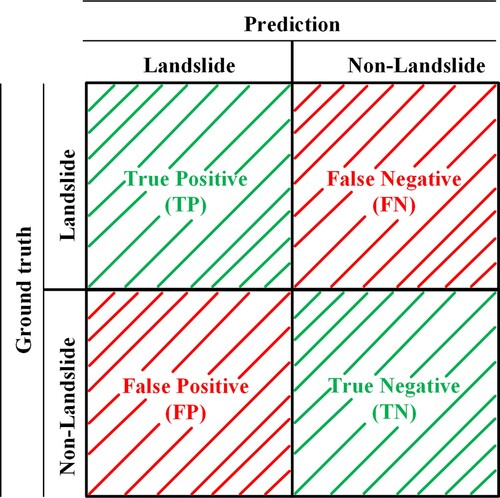
Figure 9. Training process curves of the three models. (a) U-Net, (b) U-Net Backbone, (c) Attention U-Net.
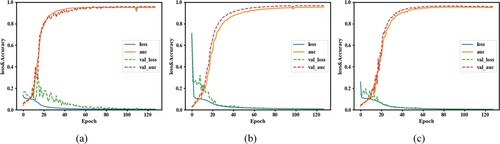
Figure 10. Evaluation index of landslide extraction results of different models.
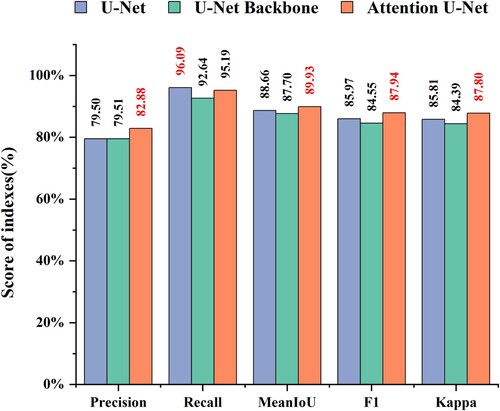
Figure 11. Extraction results of the three models on the test set. (a) Sentinel-2A images, (b) Ground truth, (c) U-Net, (d) U-Net Backbone, (e) Attention U-Net. The red circles represent the landslides extracted by different methods, showing large differences compared with the ground truth.
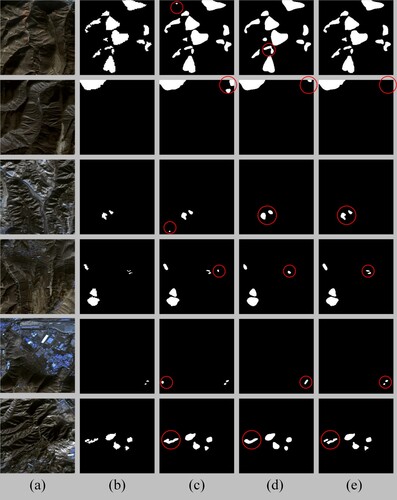
Figure 12. Probability mapping of three models when extracting landslides. (a) Ground truth, (b) U-Net, (c) U-Net Backbone, (d) Attention U-Net.
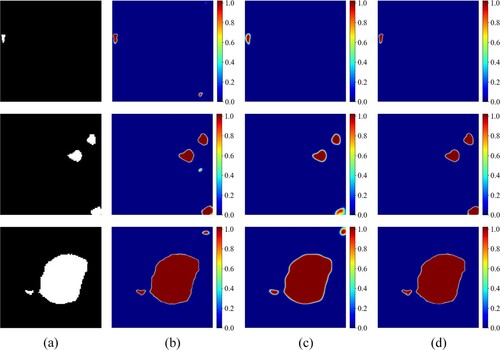
Figure 13. Landslide extraction results of the three models in the experimental area.
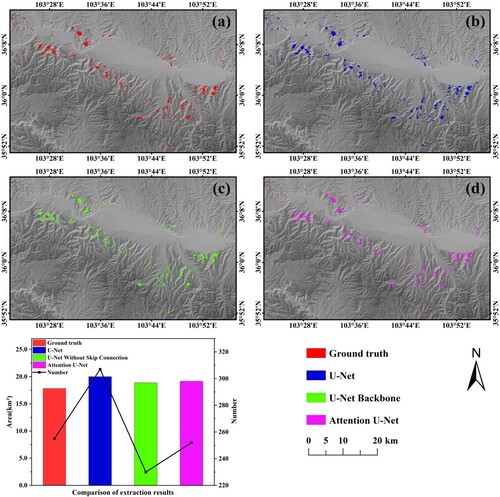
Table 4. Comparisons of model complexity.
Figure 14. Application of the model in other scenarios.
Data availability statement (DAS)
The data that support the findings of this study are available from the corresponding author upon reasonable request.