
Figures & data
Figure 1. Location and elevation of ice shelves on the Antarctic Peninsula. The ASTER GDEM is provided by the National Snow and Ice Data Center with a resolution of 100 m. The ice shelves boundary is derived from the MODIS 2003-2004 Mosaic of Antarctica (Scambos et al. Citation2007), downloaded from the Natural Earth website.
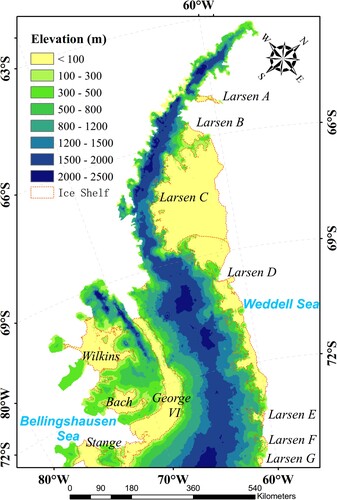
Figure 2. Monthly Sentinel-1 image acquisition totals for the Antarctic Peninsula (The orange bar represents the number of image acquisitions before Sentinel-1B was launched, and the blue bar represents the number of image acquisitions after it was launched).
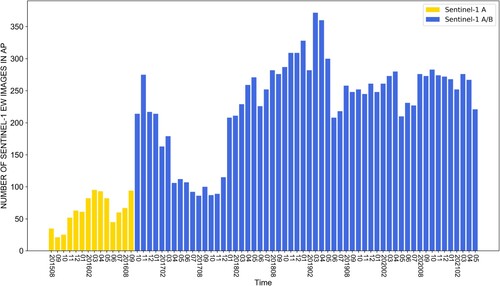
Figure 3. Time-series snowmelt detection information of three typical ice shelves (George VI, Wilkins and Larsen C ice shelf) on the Antarctic Peninsula. (a) George VI Ice Shelf (b) Wilkins Ice Shelf (c) Larsen C Ice Shelf.
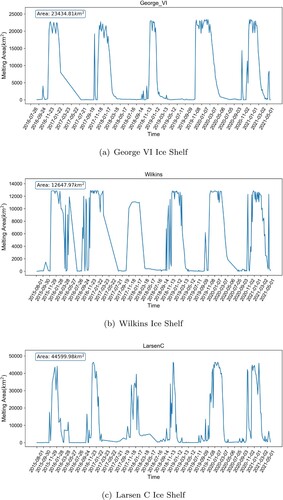
Figure 4. Freeze-thaw information for the George VI Ice Shelf in 2018/2019. (a) 2018-12-09 (b) 2018-12-14 (c) 2018-12-19 (d) 2018-12-24 (e) 2019-01-18 (f) 2019-02-02 (g) 2019-02-07 (h) 2019-02-12 (i) 2019-02-22.
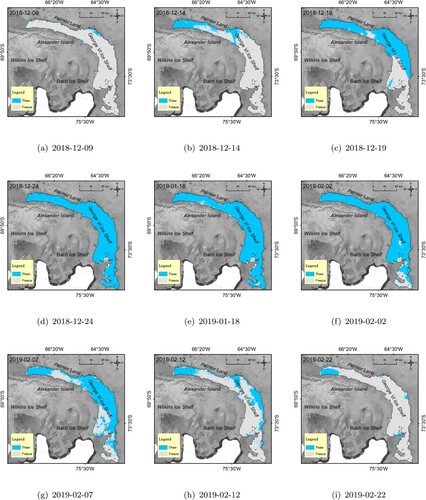
Figure 5. Freeze-thaw information for the Wilkins Ice Shelf in 2018/2019. (a) 2018-10-30 (b) 2018-11-14 (c) 2018-11-24 (d) 2018-11-29 (e) 2018-12-04 (f) 2018-12-14 (g) 2019-03-04 (h) 2019-04-08 (i) 2019-04-23.
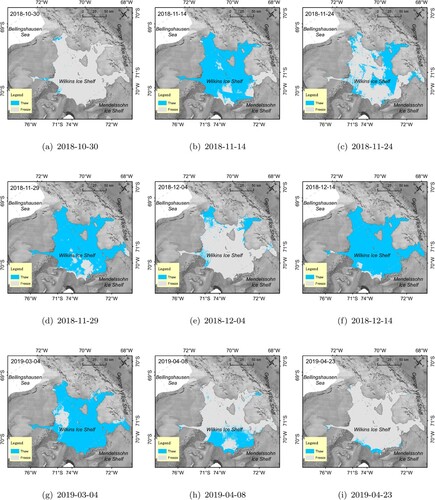
Figure 6. Freeze-thaw information for the Larsen C Ice Shelf in 2016/2017 before the A68 Iceberg broke off. (a) 2016-12-01 (b) 2016-12-16 (c) 2016-12-21 (d) 2017-01-01 (e) 2017-01-11 (f) 2017-01-21 (g) 2017-01-26 (h) 2017-02-01 (i) 2017-02-06.
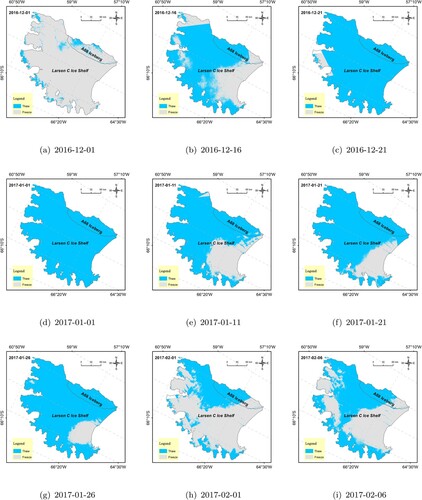
Figure 7. Visual interpretation sample selection from Sentinel-1 SAR imagery for ice shelf snowmelt detection. Blue points represent thaw samples, while yellow points represent freeze samples. (a) George VI Ice Shelf in January 2021 (summer) (b) George VI Ice Shelf in June 2020 (winter) (c) Wilkins Ice Shelf in January 2021 (summer) (d) Wilkins Ice Shelf in July 2020 (winter) (e) Larsen C Ice Shelf in January 2021 (summer) (f) Larsen C Ice Shelf in June 2020 (winter).
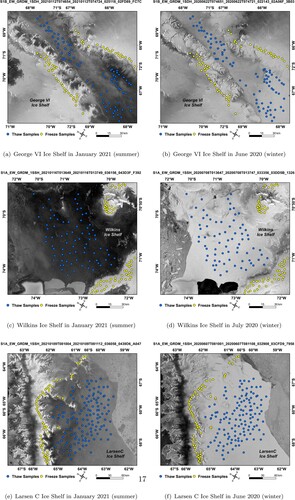
Table 1. Accuracy assessment for ice shelf snowmelt detection.
Figure 8. The monthly melt area of the Antarctic Peninsula from August 2015 to May 2021. Notably that the data for June and July are missing, as these data were used as reference images to normalize the others.
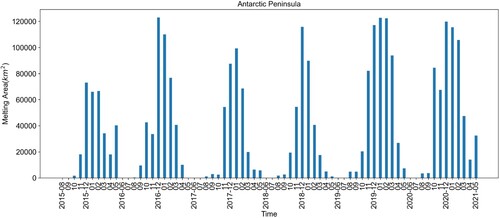
Figure 9. Spatial distribution of melting percentage of Antarctic Peninsula ice shelves in March from 2015 to 2021 color-coded from blue (low melting proportion) to red (high melting proportion). The basemap is the Mosaic of cloud-free Moderate Resolution Imaging Spectroradiometer (MODIS) images over the Antarctic Peninsula. (a) 2016-03 (b) 2017-03 (c) 2018-03 (d) 2019-03 (e) 2020-03 (f) 2021-03.
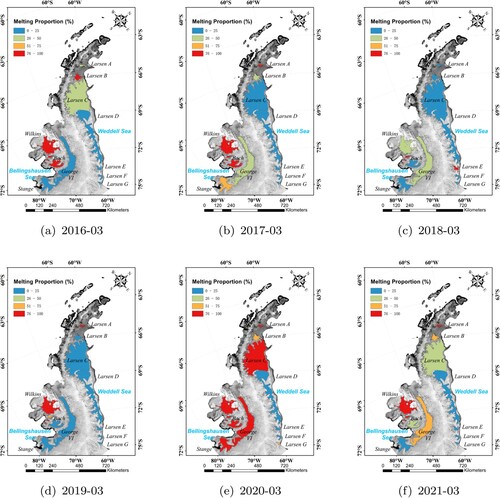
Figure A1. Freeze-thaw information for George VI Ice Shelf in 2019/2020. (a) 2019-11-19 (b) 2019-11-24 (c) 2020-02-22 (d) 2020-03-18(e) 2020-03-23 (f) 2020-04-02 (g) 2020-04-12 (h) 2020-05-02 (i) 2020-05-07.
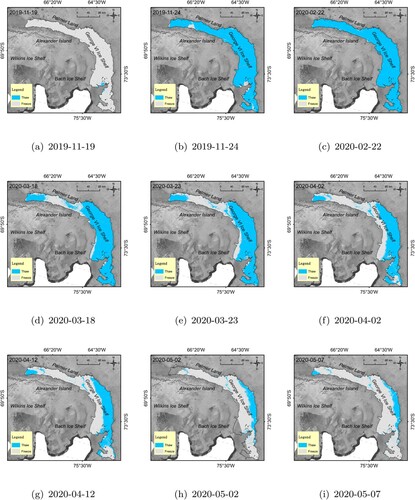
Figure A2. Time-series snowmelt information of ice shelves on the east coast of the Antarctic Peninsula. (a) Larsen A Ice Shelf (b) Larsen B Ice Shelf (c) Larsen D Ice Shelf (d) Larsen E Ice Shelf (e) Larsen F Ice Shelf (f) Larsen G Ice Shelf.
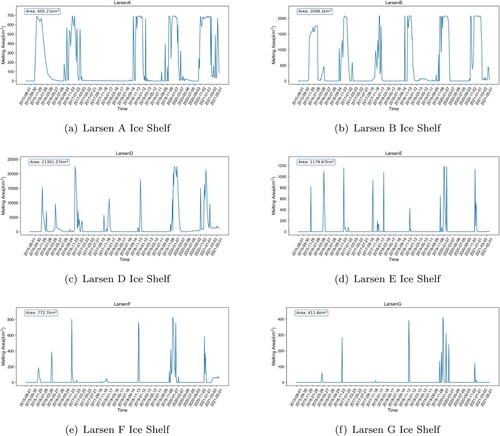
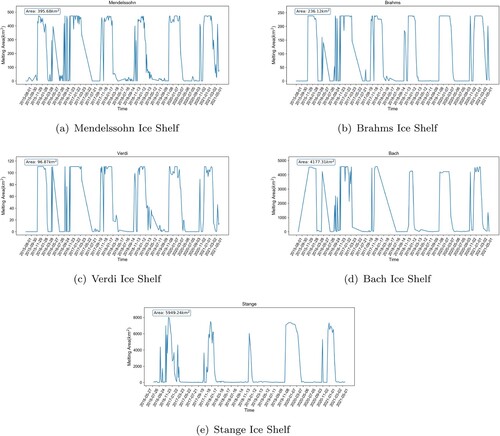
Figure A3. Time-series snowmelt information of ice shelves on the west coast of the Antarctic Peninsula. (a) Mendelssohn Ice Shelf (b) Brahms Ice Shelf (c) Verdi Ice Shelf (d) Bach Ice Shelf (e) Stange Ice Shelf.
Data availability statement
The Sentinel-1 imagery is available at the Google Earth Engine data catalog (https://developers.google.com/earth-engine/datasets). The DEM of Antarctic Peninsula and ice shelf boundary are publicly available at National Snow and Ice Data Center (https://nsidc.org/data/nsidc-0516/versions/1) and British Antarctic Survey website (https://data.bas.ac.uk/).