Figures & data
Figure 1. Study area.
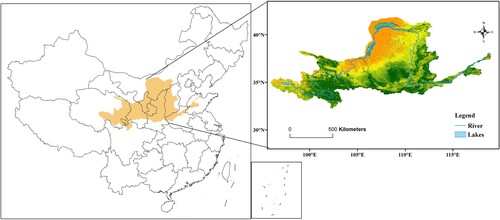
Figure 2. Subareas of the study area.
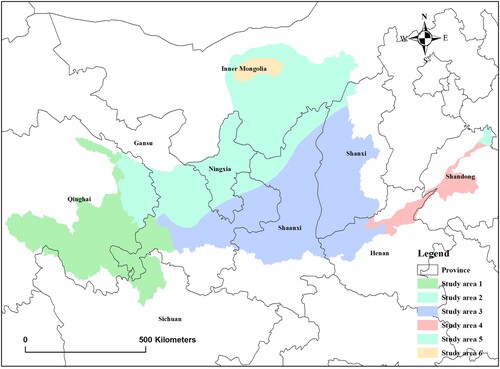
Figure 3. Principle diagram of the feature space.
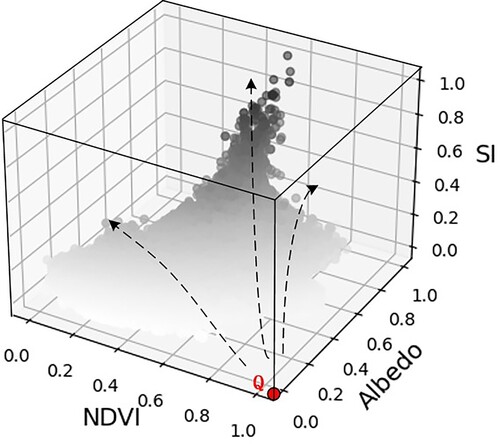
Table 1. Cultivated land classification.
Figure 4. Classification process map.
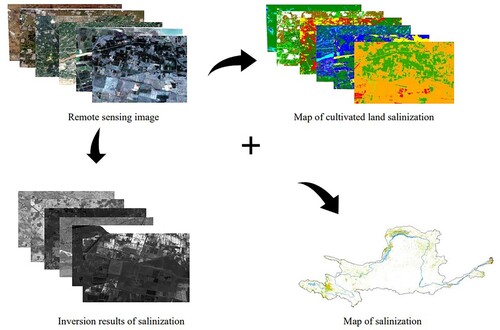
Figure 5. (a) Yellow River Basin salinization distribution map in 2015; (b) Yellow River Basin salinization distribution map in 2020.
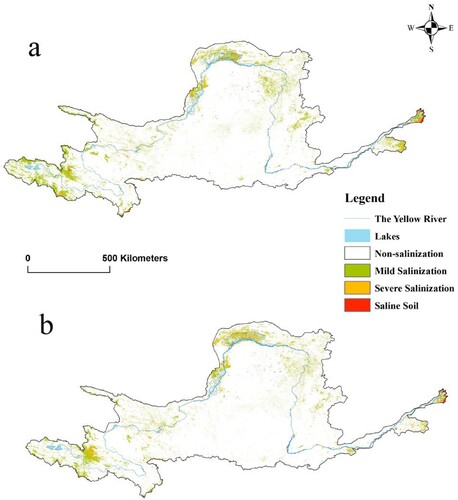
Figure 6. Detailed map of salinization distribution.
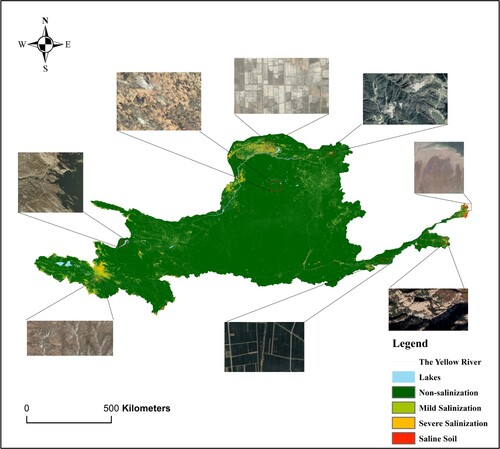
Figure 7. Proportion of salinization in each province of the Yellow River Basin (the proportion of salinization soil in each province of the Yellow River Basin in the total the Yellow River Basin).
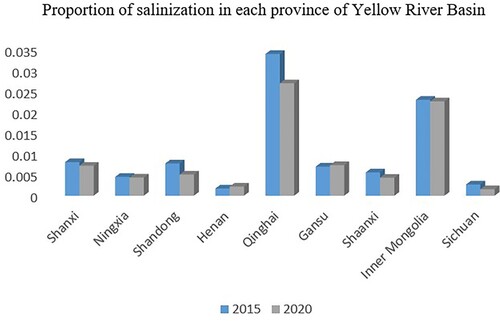
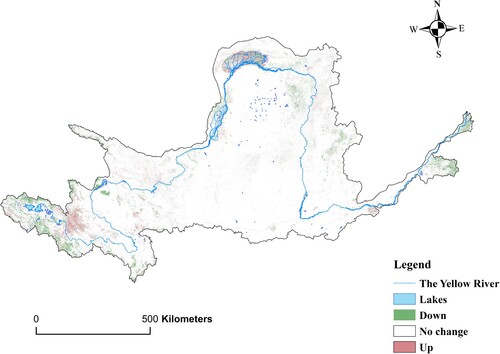
Figure 8. Salinization degree change map.