Figures & data
Figure 1. The flow of the work.
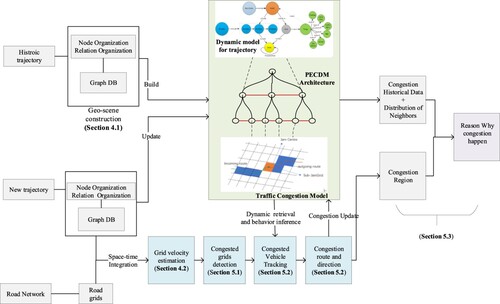
Figure 2. Relationship diagram of spatio-temporal dynamics in congestion.
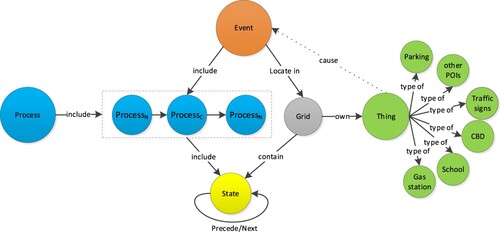
Figure 3. State-process-event spatio-temporal diagram of taxis.
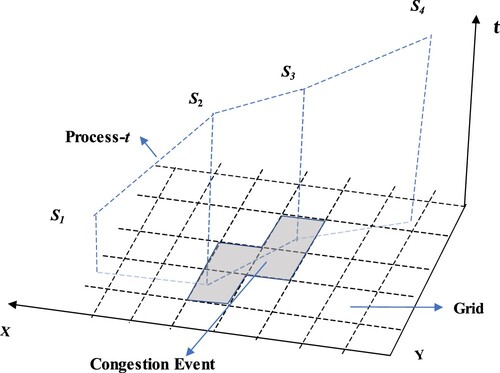
Figure 4. Diagram of a traffic jam geo-event.
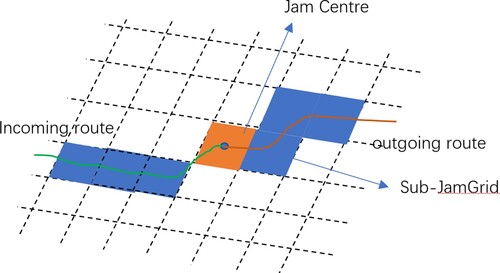
Figure 5. The structure of the traffic jam geo-event model.
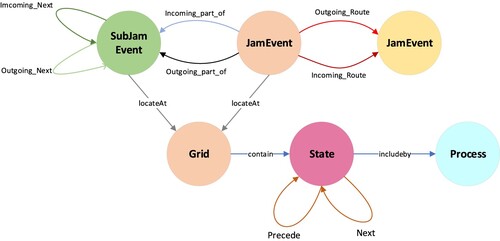
Table 1. A rule defining traffic congestion levels.
Figure 6. The structure of the road and grid.
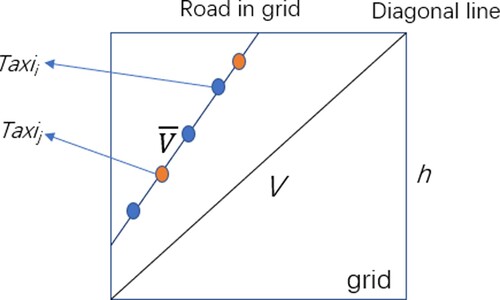
Table 2. Detection parameters for different congestion levels.
Figure 7. A flow diagram of the algorithm for detecting traffic jams.
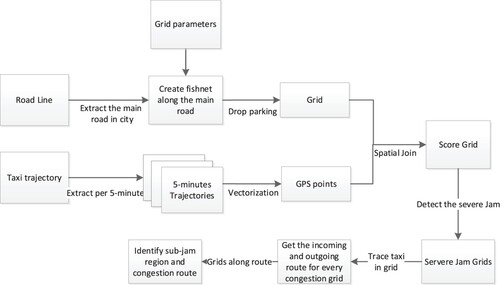
Figure 8. Study area and taxi trajectory data distribution.
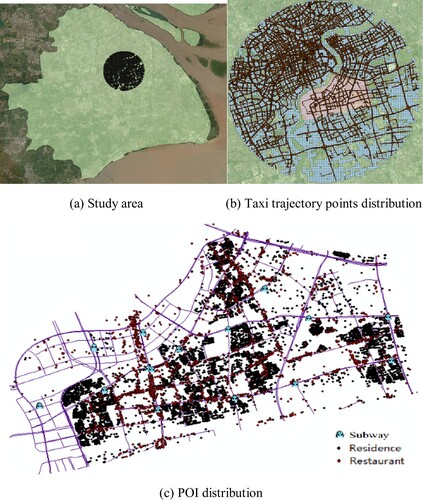
Table 3. The structure of a state node.
Table 4. The structure of a relationship.
Figure 9. Distribution of severely congested grids(red rectangles) within 17:30–17:40 on April 11.
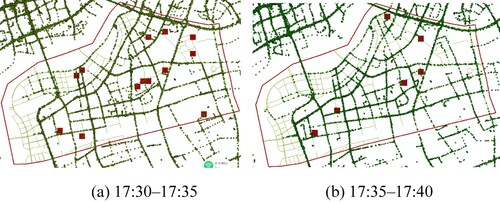
Figure 10. Distribution of generally congested grid cells from 17:30–17:40.
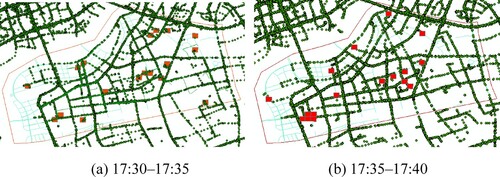
Figure 11. Three trajectories through the congestion center.
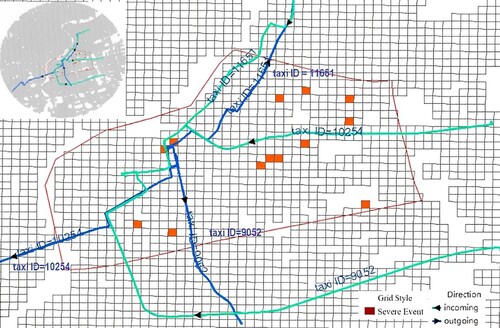
Figure 12. Sub-congestion grid cells of the severe congestion grid.
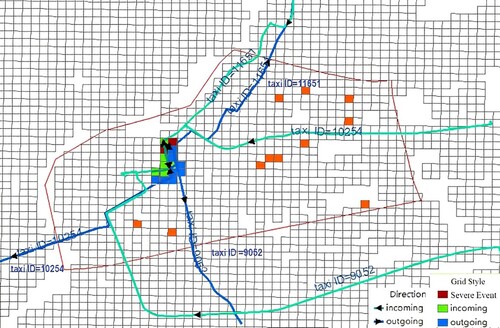
Figure 13. Graph structure of the traffic jam event in Grid 2581.
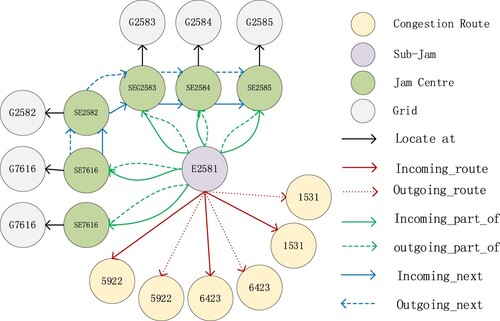
Figure 14. Detection of bidirectional traffic jam events.
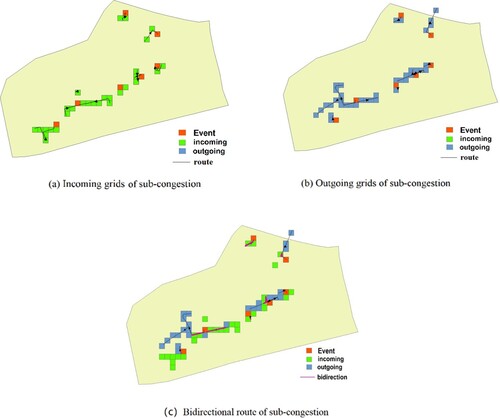
Figure 15. Congestion indicator distribution from 17:00–19:30 on April 11.
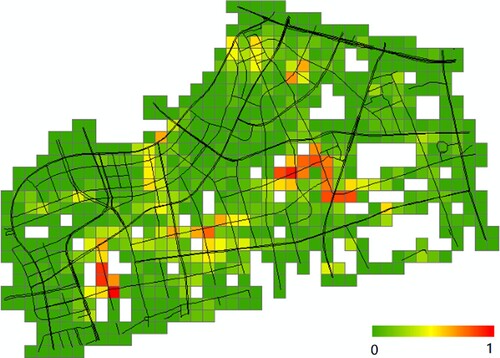
Figure 16. Hotspot distribution of drop-off taxis from 17:00–22:00 on April 11 and April 25.
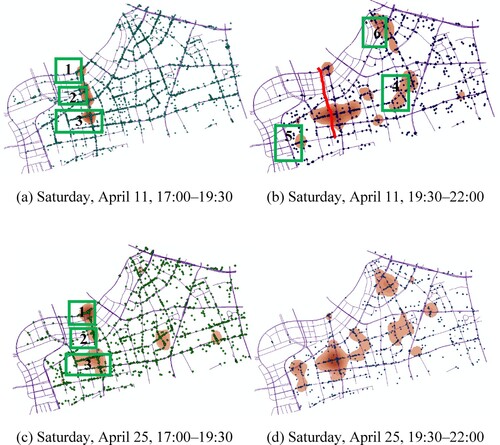
Figure 17. Traffic congestion distribution from 17:00–19:30 on April 25.
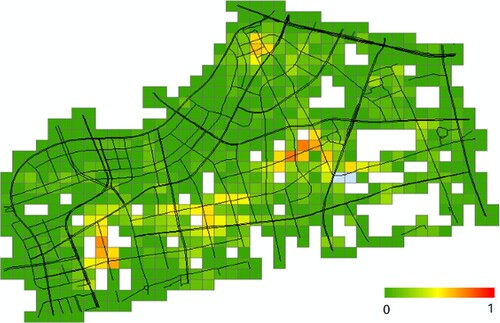
Table 5. Drop-off count of taxis in different areas in (b).
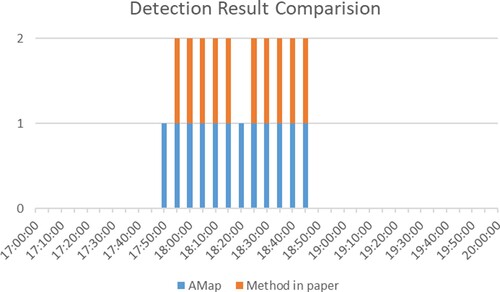
Figure 18. Detection accuracy comparison between AMap and method in the paper.