
Figures & data
Figure 1. Framework for crowd evacuation modeling and simulation by using deep reinforcement learning and 3D physical environments.
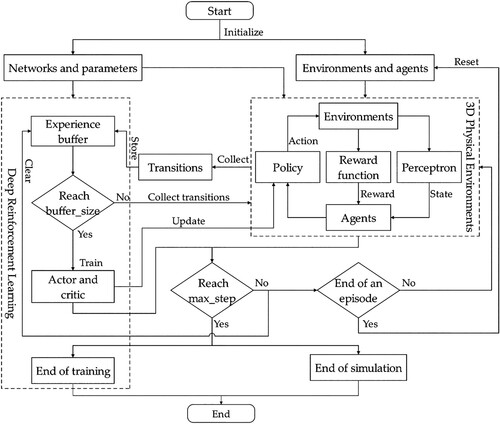
Figure 2. Modeling of crowd evacuation scenarios.
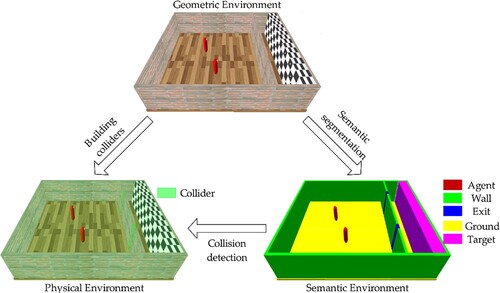
Figure 3. Modeling of agents’ perceptron. (a) Vertical field of the agents’ vision; (b) horizontal field of the agents’ vision; (c) schematic diagram of the vision-like ray perceptron. Only perceptual rays in the horizontal plane are shown.
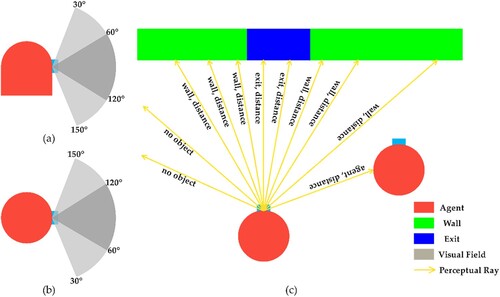
Figure 4. Training-learning mode of PPO.
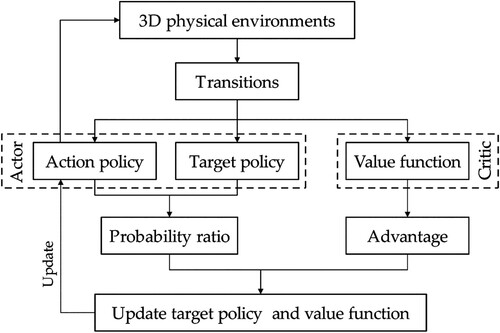
Figure 5. Double branch feature extraction combined actor and critic network.
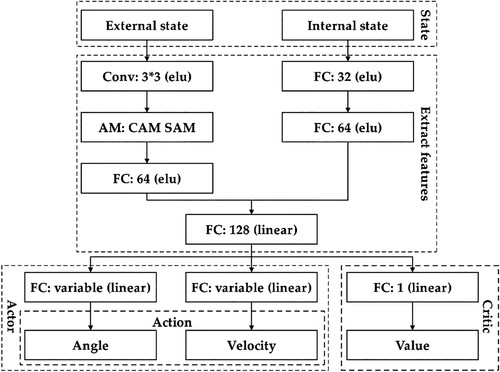
Table 1. Configuration of parameters.
Figure 6. Simulation in the scenario with one exit. (a-d) stills of the simulation results. The temporal sequence of these stills is labeled alphabetically.
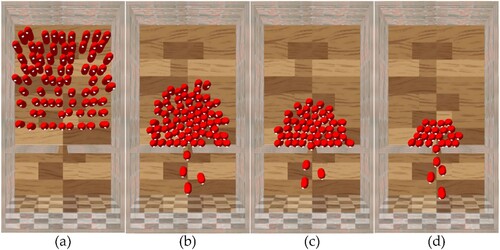
Figure 7. Density maps of crowd evacuations. (a) Density map generated by the real crowd experiment; (b) density map generated by our simulation.
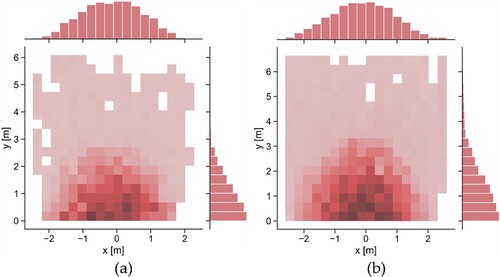
Figure 8. Fundamental diagrams of crowd evacuations. (a) fundamental diagram generated by the real crowd experiment; (b) fundamental diagram generated by our simulation.
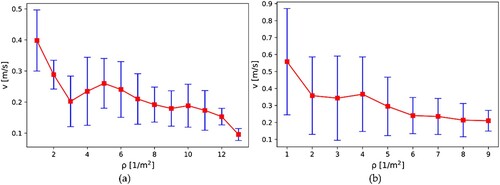
Figure 9. Impact of various factors on crowd evacuation in S1Es. (a) width of exit; (b) number of agents; (c) mass of agents; (d) height of agents. (a-b) represent the relationship between the number of evacuated agents and the evacuation time.
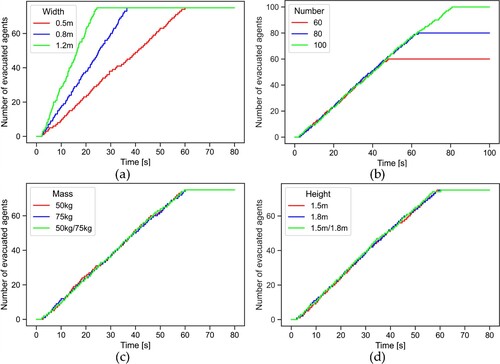
Figure 10. Relationship between evacuation efficiency and exit width.
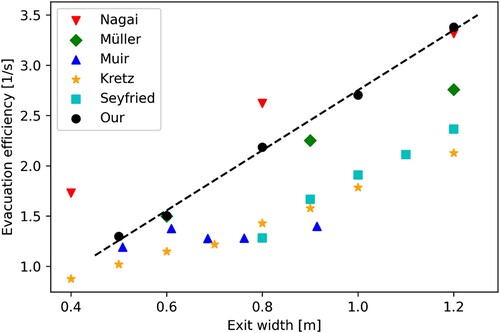
Figure 11. Simulations in the scenarios with two exits and a uniform distribution of agents. (a–c) Stills of the simulation results in different S2Es. (a) S2E:L0.5-R0.5; (b) S2E:L0.8-R0.5; (c) S2E:L0.5-R0.8.
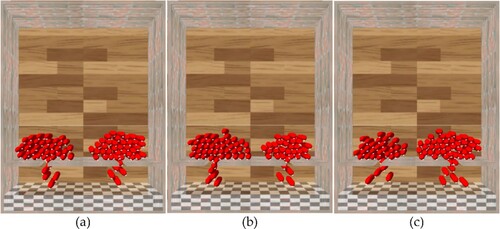
Figure 12. Density maps of simulation results in different S2Es. (a) S2E:L0.5-R0.5; (b) S2E:L0.8-R0.5; (c) S2E:L0.5-R0.8.
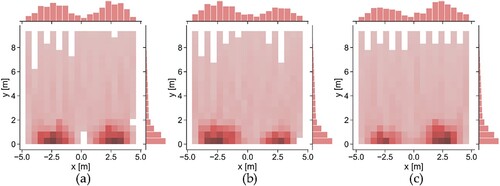
Figure 13. Relationship between the initial position and evacuation exit in different S2Es. (a) S2E:L0.5-R0.5; (b) S2E:L0.8-R0.5; (c) S2E:L0.5-R0.8. (a–c) The black dotted lines indicate that the distances to the left and right exits are equal.
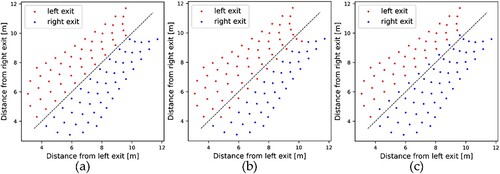
Table 2. Evacuation statistics of two exits in S2Es.
Figure 14. Simulations in the scenarios with two exits and a nonuniform distribution of agents. (a-c) Stills of the simulation results in different NS2Es. (a) NS2E:L0.5-R0.5; (b) NS2E:L0.8-R0.5; (c) NS2E:L0.5-R0.8.
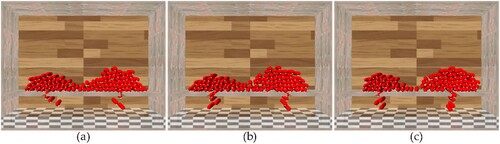
Figure 15. Density maps of simulation results in NS2Es. (a) NS2E:L0.5-R0.5; (b) NS2E:L0.8-R0.5; (c) NS2E:L0.5-R0.8.
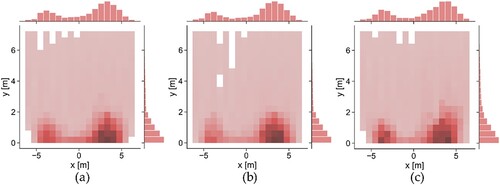
Table 3. Evacuation statistics of two exits in NS2Es.
Figure 16. Impact of agent height on evacuation in the scenarios with two exits. (a) S2E:L0.5-R0.5; (b) NS2E:L0.5-R0.5. (a-b) represent the relationship between the number of evacuated agents and the evacuation time.
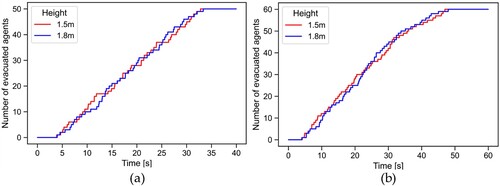
Figure 17. Relationship between the initial position and evacuation exit in different NS2Es. (a) NS2E:L0.5-R0.5; (b) NS2E:L0.8-R0.5; (c) NS2E:L0.5-R0.8. (a-c) The black dotted lines indicate that the distances to the left and right exits are equal.
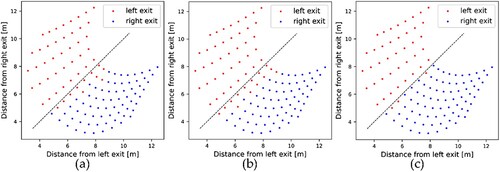
Table 4. Evacuation times in NS2Es.
Data availability statement
The data that support the findings of this study can be obtained from the corresponding author upon reasonable request.