
Figures & data
Figure 1. The tested tool with a multiple-legend layout (a) and a single-legend layout (b). Legend elements are marked with green areas: map key, metrics buttons, metrics drop-down list & timeline, county search (please refer to online colour version of the figure).
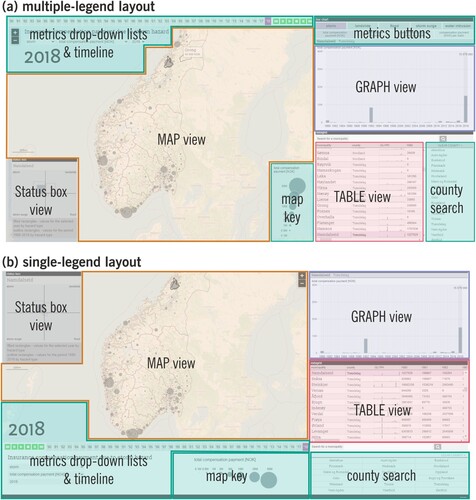
Table 1. Task types and questions used in the study.
Figure 2. The procedure of the empirical study.
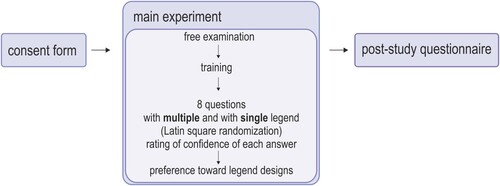
Figure 3. Participants’ average performance and confidence by legend layout.
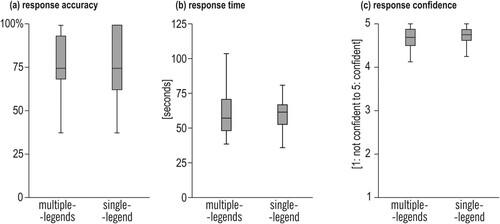
Figure 4. Participants’ average performance and confidence by task (error bars: ± 2SEM).
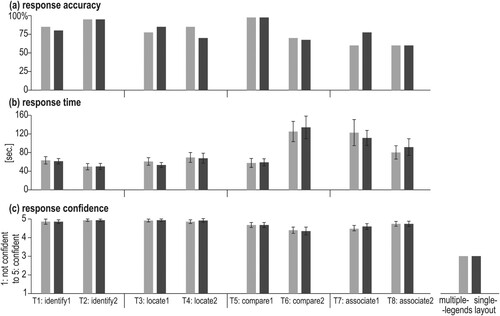
Figure 5. The AOIs distinguished in multiple- (left) and single-legend (right) layouts.
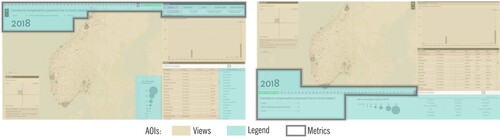
Figure 6. Differences in the eye movement metric for tasks 1–8 between multiple- and single-legend layouts (Error bars ±2SE; ***p < .001).
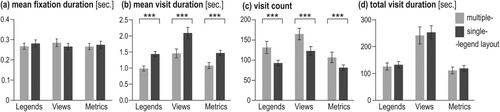
Figure 7. Mean visit duration and visit count for each given task (error bars ±2SE; *p < .05; **p < .01; ***p < .001).
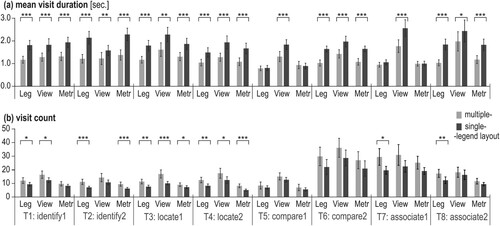
Figure 8. Transitions between elements of the interface in the multiple-legend layout (a) and the single-legend layout (b) (for clarity, the average number of transitions fewer than two are not presented). Own elaboration using a Circos Table Viewer (Krzywinski et al. Citation2009).
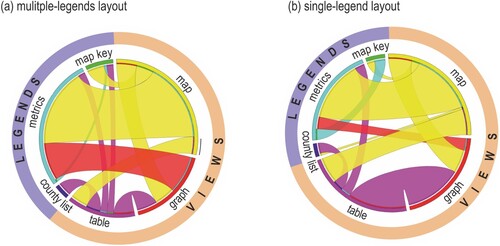
Figure 9. The average number of transitions between and within AOIs Views and Legends (error bars ±2SE; *p < .05; **p < .01; ***p < .001).
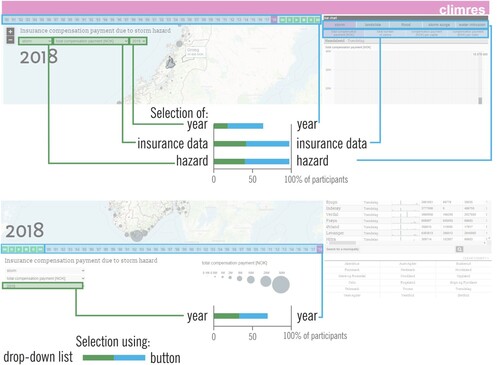
Figure 10. The way of setting the attributes from redundant interface elements. The missing share of 100% indicates the participants who failed in selecting the needed attributes and/or decided to keep the default settings.
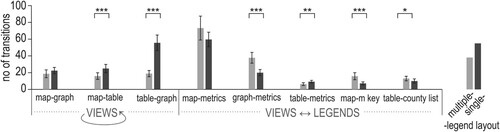
Figure 11. The use of redundant elements, buttons and drop-down lists, in the multiple-legend layout.
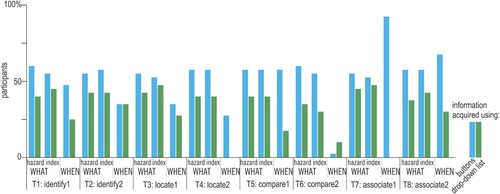
Figure 12. The views from which the searched information was acquired.
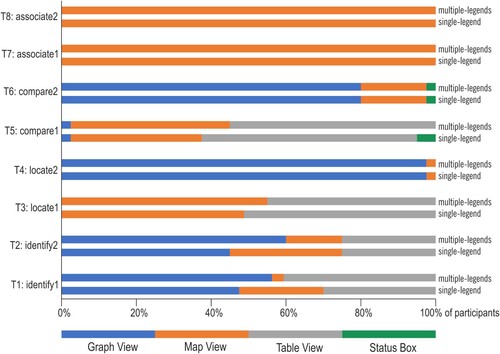
Figure 13. Participants’ layout preference after solving the given tasks.
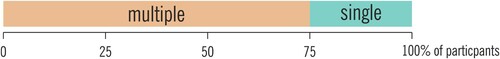
Figure 14. SUS scores for multiple- and single-legend layouts.
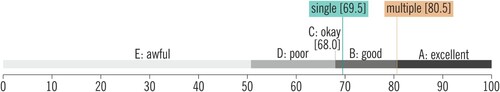
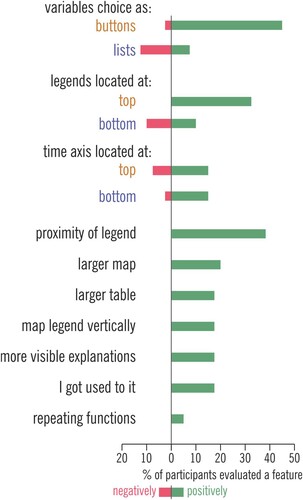
Figure 15. Criteria of selection declared while indicating preferred layout. Make note that the percentage regarding the two layouts referred to a different number of participants (75% of participants indicated multiple- and 25% of participants indicated a single-legend layout). Each participant could select several criteria.
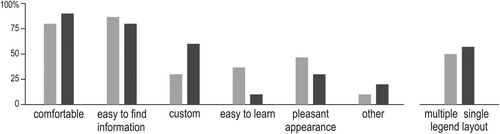
Figure 16. Criteria of layout evaluation reported by participants.
Supplemental Material
Download MS Word (29.3 KB)Data availability statement
The data that support the findings of this study are available from the corresponding author upon reasonable request.