
Figures & data
Figure 1. Geographic situation of the studies zones and districts.
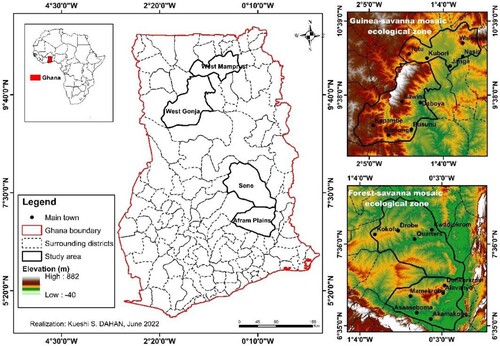
Table 1. Characteristics of the data used in this research and their references
Table 2. Drought classification according to the SPI values (McKee, Doesken, and Kleist (Citation1993))
Table 3. PDSI categorisation of drought severity (Palmer Citation1965).
Table 4. Designation of variables used in for computing of RH.
Table 5. Data requirements for application of the SWB model (Finkelstein et al. Citation2022).
Table 6. Designation of variables used in for computing of ETR (ASCE-EWRI Citation2005).
Table 7. Rainfall Anomalies Index classification (Freitas Citation2005).
Figure 2. Monthly rainfall variation in Guinea-savannah (a) and Forest-savannah mosaic (b) zones.
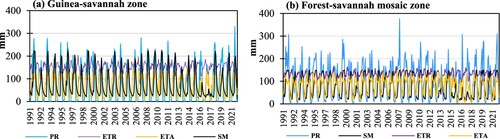
Figure 3. Annual variation of SPI and PDSI in Guinea-Savannah (a) and Forest-savannah mosaic (b) zones.
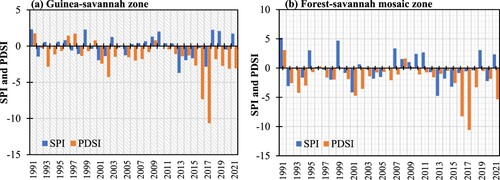
Table 8. Variation in climatic (SPI) (a) and hydrological (PDSI) (b) drought in Guinea-Savannah and Forest-savannah mosaic zones.
Figure 4. Monthly temperature variation in Guinea-Savannah (a) and Forest-savannah mosaic (b) zones.
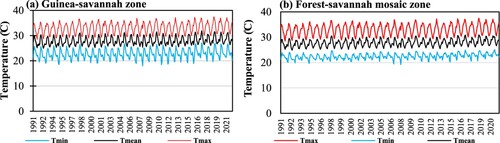
Figure 5. Monthly variation of relative humidity and wind speed in Guinea-Savannah (a) and Forest-savannah mosaic (b) zones.
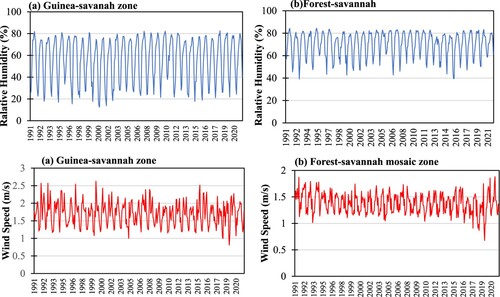
Figure 6. Monthly spatial presentation of climatic and environmental parameters in Guinea-Savannah (a) and Forest-Savannah mosaic (b) zones.
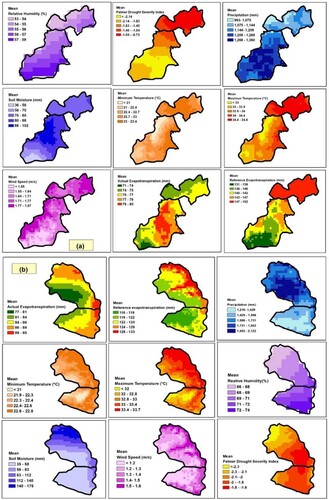
Figure 7. Annual rainfall anomaly in Guinea-Savannah (a) and Forest-savannah Mosaic (b) zones.
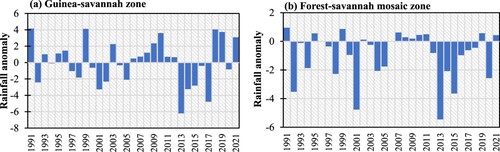
Figure 8. Annual thermometric anomaly in Guinea-Savannah (a) and Forest-Savannah mosaic (b) zones.
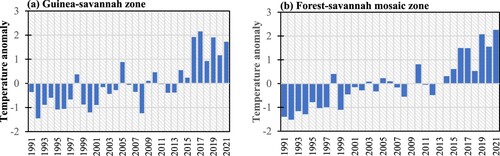
Figure 9. Annual soil moisture anomaly in Guinea-Savannah (a) and Forest-Savannah mosaic (b) zones.
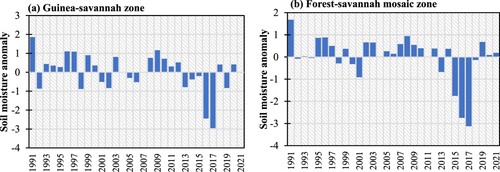
Figure 10. Annual moisture anomaly in Guinea-Savannah (a) and Forest-Savannah mosaic (b) areas.
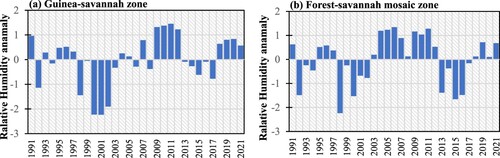
Figure 11. Annual variation of fire risk indices in Guinea-Savannah (a) and Forest-Savannah mosaic (b) areas.
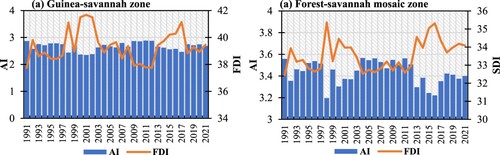
Table 9. Period of HR and SM breakdown in Guinea-Savannah (a) and Forest-Savannah mosaic (b) areas.
Table 10. Trend of different variables in Guinea-Savannah (a) and Forest-Savannah mosaic (b) areas.
Figure 12. Spearman's correlation matrix in Guinea-Savannah (a) and Forest-savannah mosaic (b) areas (Significant at *p < 0.05; ** p < 0.01; and *** p < 0.001).
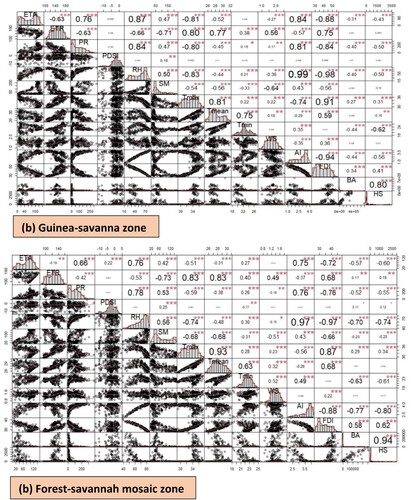
Table 11. Cross-correlation function between climatic, environmental and burned area variables in Guinea-Savannah (a) and Forest-Savannah mosaic (b) zones.
Table 12. Cross-correlation function between climatic, environmental and active fires variables in Guinea-Savannah (a) and Forest-Savannah mosaic (b) zone.
Data availability statement
Data (climatic and environmental data) used in this paper are respectively available at https://code.earthengine.google.com/fa9846d34c532e5f6d043ad4f7376640; https://code.earthengine.google.com/0eba04b7ded613d5a05e811ea2b5ee36 for Guinea-Savannah zone and Forest-savannah zone and fire data on https://doi.org/10.5281/zenodo.7749206.