
Figures & data
Table 1. The detailed information of various Rs products used in this study.
Table 2. The detailed information of CMIP6 GCMs used in this study.
Figure 1. Spatial distributions of the observation stations.
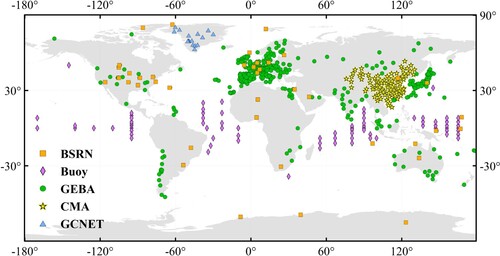
Figure 2. Evaluation results of monthly Rs estimates from seven products against the ground measurements from BSRN, CMA, GEBA, GC-NET and buoys.
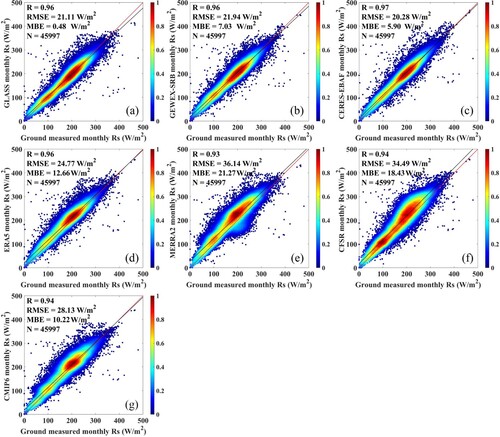
Table 3. Summary of performance statistics for surface measurements of five networks and seven monthly Rs estimates from 2001 to 2010. The units of Bias and RMSE are W/m2.
Figure 3. Spatial distributions of RMSEs of (a) GLASS; (b) ERA5; (c) GEWEX-SRB; (d) MERRA2; (e) CERES-EBAF; (f) CFSR; (g) CMIP6 Rs against ground measurements on monthly scale.
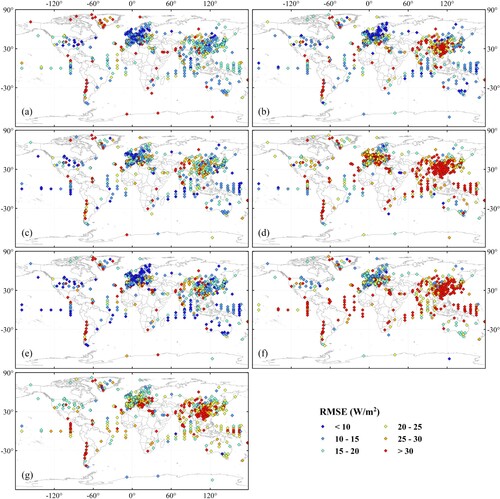
Figure 4. Spatial distributions of biases of (a) GLASS; (b) ERA5; (c) GEWEX-SRB; (d) MERRA2; (e) CERES-EBAF; (f) CFSR; (g) CMIP6 Rs against ground measurements on monthly scale.
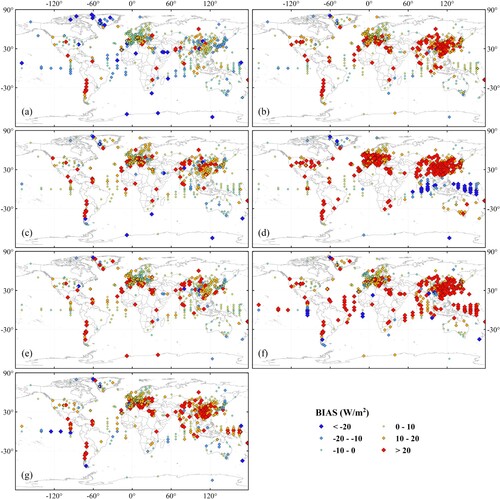
Figure 5. Spatial distribution of ten-year (2001–2010) mean Rs of (a) GLASS; (b) ERA5; (c) GEWEX-SRB; (d) MERRA2; (e) CERES-EBAF; (f) CFSR; (g) CMIP6.
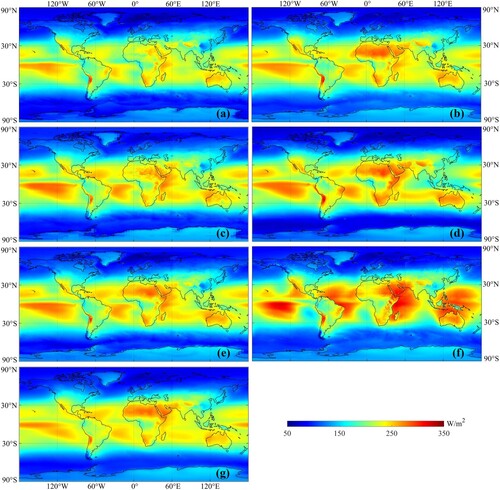
Figure 6. Box plots of ten-year (2001–2010) annual mean Rs in (a) global; (b) land; (c) ocean of the selected seven products. For each box, the blue point is the mean Rs, and the circle is the outliers. The central line represents the median value, while the lower and upper edge symbolize the 25th (v1) and 75th (v3) percentiles, respectively. The top line is calculated by [v3 + 1.5 × (v3 − v1)] while the bottom line is [v1 − 1.5 × (v3− v1)].
![Figure 6. Box plots of ten-year (2001–2010) annual mean Rs in (a) global; (b) land; (c) ocean of the selected seven products. For each box, the blue point is the mean Rs, and the circle is the outliers. The central line represents the median value, while the lower and upper edge symbolize the 25th (v1) and 75th (v3) percentiles, respectively. The top line is calculated by [v3 + 1.5 × (v3 − v1)] while the bottom line is [v1 − 1.5 × (v3− v1)].](/cms/asset/be0c09fc-2852-487c-9e75-d690fe1c4b0f/tjde_a_2198262_f0006_oc.jpg)
Table 4. Overview of the maximum, minimum and mean value of Rs over globe, land and ocean of the seven products during 2001–2010 (Units are W/m2).
Table 5. The average Rs of seven products under different latitude zones during 2001–2010 (Units are W/m2).
Figure 7. Annual Rs anomaly in (a) globe; (b) land; (c) ocean of the GLASS, GEWEX-SRB, CERES-EBAF, ERA5, MERRA2, CFSR and CMIP6 GCMs.
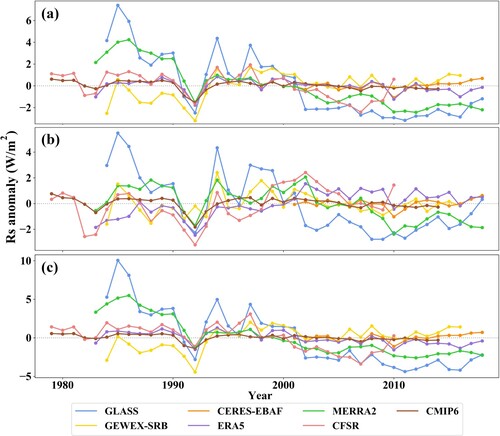
Table 6. Trend comparison of annual mean Rs from seven products over globe, land and ocean during the whole time series of each product and the period of 2001–2010.
Figure 8. Spatial distribution of multi-year (2001–2010) trends of Rs for (a) GLASS; (b) ERA5; (c) GEWEX-SRB; (d) MERRA2; (e) CERES-EBAF; (f) CFSR; (g) CMIP6. The solid dots indicate grids at 95% confidence.
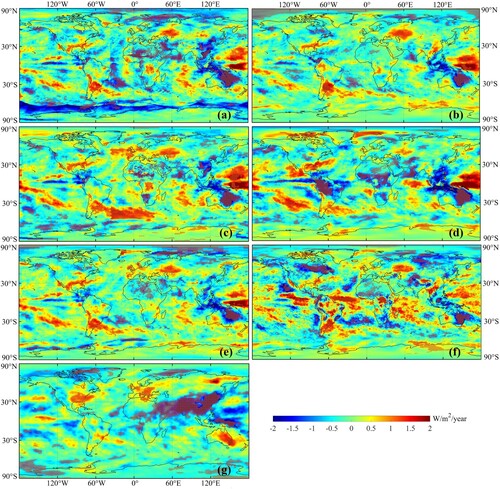
Figure A1. Evaluation results of monthly Rs estimates from seven products against the ground measurements from BSRN.
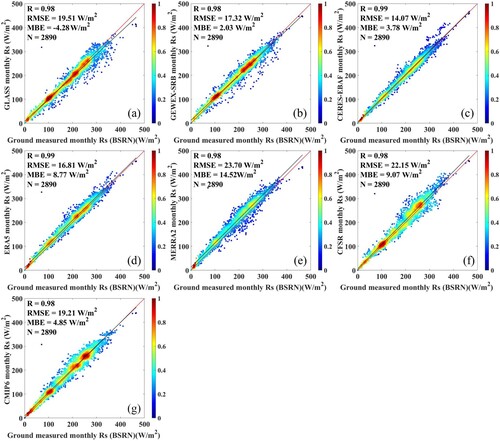
Figure A2. Evaluation results of monthly Rs estimates from seven products against the ground measurements from CMA.
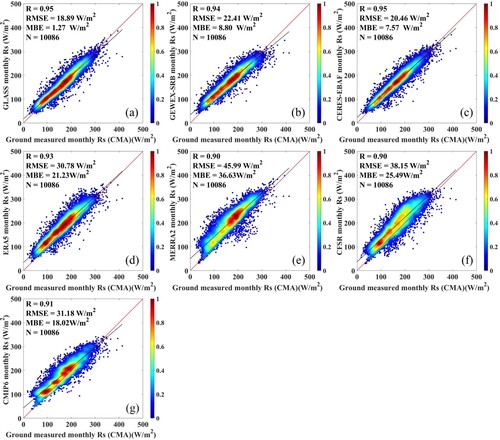
Figure A3. Evaluation results of monthly Rs estimates from seven products against the ground measurements from GEBA.
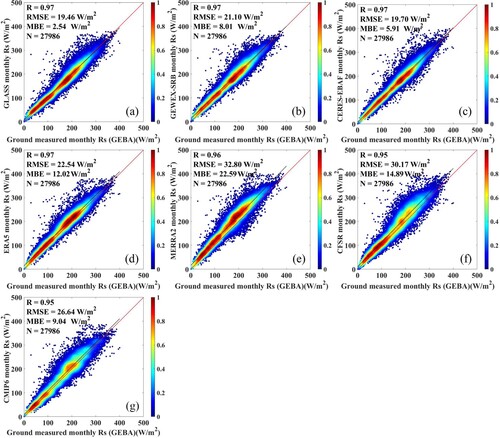
Figure A4. Evaluation results of monthly Rs estimates from seven products against the ground measurements from GC-NET.
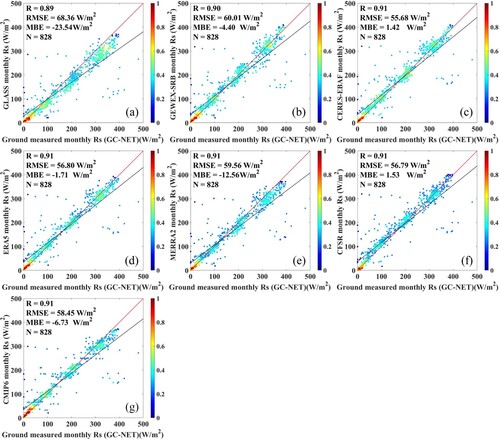
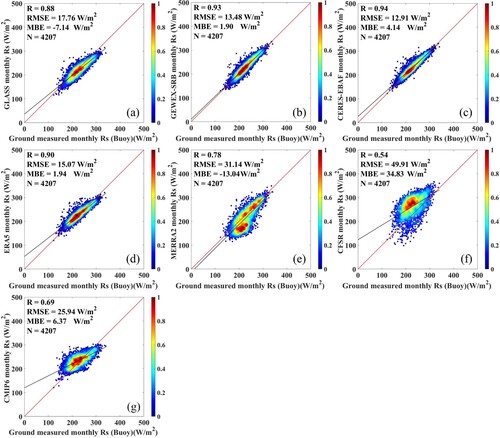
Figure A5. Evaluation results of monthly Rs estimates from seven products against the ground measurements from buoys.
Data availability statement
The ground measurements collected from BSRN, GEBA, CMA, GC-NET and Buoys in this study are downloaded at https://bsrn.awi.de/, https://geba.ethz.ch/, https://data.cma.cn/, http://cires1.colorado.edu/science/groups/steffen/gcnet/ and https://www.pmel.noaa.gov/tao/drupal/disdel/, respectively. The GEWEX-SRB and CERES-EBAF data are available at https://science.larc.nasa.gov/gewex-srb/ and https://ceres.larc.nasa.gov/data/. The reanalysis datasets are available at https://www.ecmwf.int/en/forecasts/datasets/reanalysis-datasets/era5, https://disc.gsfc.nasa.gov/datasets?project=MERRA-2 and https://climatedataguide.ucar.edu/climate-data/climate-forecast-system-reanalysis-cfsr. The Rs simulations from CMIP6 GCMs are available at https://esgf-node.llnl.gov/search/cmip6/.