
Figures & data
Table 1. Selected definitions of the term forest.
Figure 1. Roles of data user, data producer, and software developer and their interactions within the process of improving the availability and accessibility of provenance and data quality information. Numbers inside parentheses represent the sequence of steps of this process.
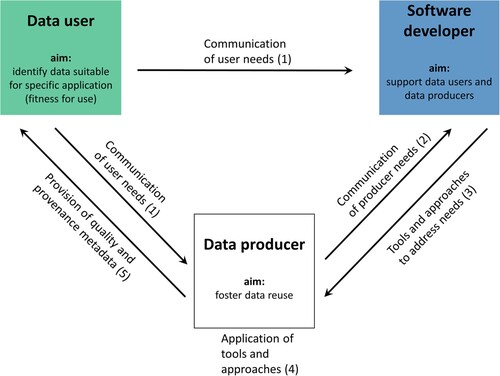
Table 2. Summarized overview of openness, FAIRness and data maturity, and detailed overview of quality of yield data evaluated in the use case (Monfreda, Ramankutty, and Foley Citation2008; Yu et al. Citation2020). Openness is high for both datasets. FAIRness and data maturity are higher for MapSPAM, but for both datasets data quality and provenance information is missing in the metadata and evaluated data quality information was derived from the dataset and associated publications.
Table 3. Overview of approaches to increase the availability and accessibility of metadata for geospatial datasets and related tools.
Figure 2. Forest accuracy comparison between 3 time-series in sub-Saharan Africa (2001-2020). Forest accuracy based on 53,132 validation samples (collected from 13 different sources (Bastin et al. Citation2017; Bullock et al. Citation2021; Dupuy Citation2019; Fritz et al. Citation2016; Herrick et al. Citation2019; Jolivot et al. Citation2021; Laurence et al. Citation2019; Lesiv Citation2019; Liangyun et al. Citation2019; Londoño Villegas, Le Mezo, and Dupuy Citation2019; Szantoi et al. Citation2020; Vågen, Okia, and Winowiecki Citation2017; VALERI Citation2022)) during the period 2001–2020 for the time series: ESA-CCI (dotted lines), MODIS (solid lines) and Hansen (dashed lines). Maps and plots show the distribution and number of correct and wrong locations along latitude and longitude.
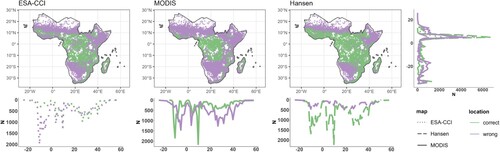
Figure 3. Visual representation of the ontology developed in this project with the ontologics R-package. Circles that are nested into bigger circles show hierarchically narrower concepts. Commodities are only partially visualized for clarity, but can be found in the online version of the ontology (Ehrmann, Rümmler, and Meyer Citation2022).
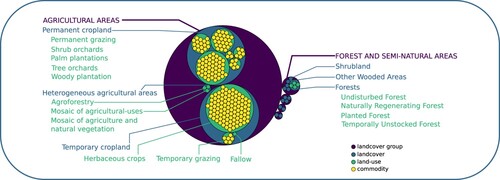
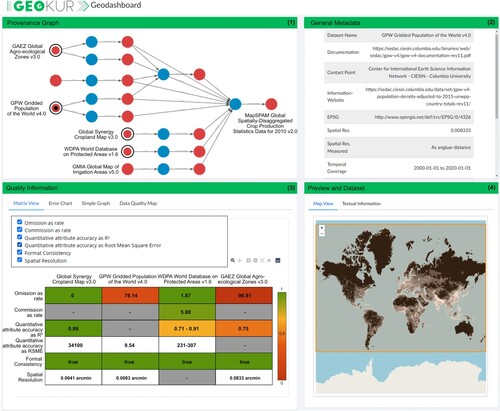
Figure 4. Dashboard showing provenance information, general metadata, and data quality for the MapSPAM (Yu et al. Citation2020) dataset. The provenance graph shows that input data included irrigation. Since irrigation is also used as a predictor in the downstream analysis, this could bias statistical parameter estimates and cause circular reasoning. Information was generated based on the methodological descriptions in associated publications and supplements.
Data availability statement
The survey data that support the findings of this study are openly available on Zenodo at http://doi.org/10.5281/zenodo.737901 . Raw survey data were generated at Helmholtz Centre for Environmental Research – UFZ and are available from the corresponding author JF on request. All other data that support the findings of this study are openly available and directly referenced within the article.