
Figures & data
Figure 1. Distributions of Global Climate Regions.
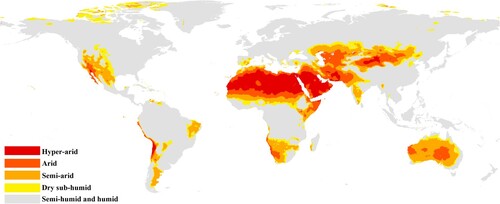
Table 1. Climatic regionalization indicators of desertification.
Table 2. Grading standard for assessment of global grassland degradation trends.
Figure 2. Distribution of global grassland degrading and improving areas from 2000–2020.
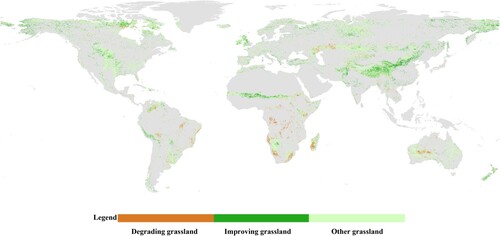
Figure 3. Degrading and improving areas of global grassland in different continents.
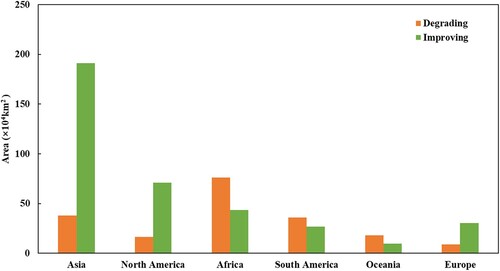
Table 3. Statistics on the global grassland degrading areas in different climatic regions across continents (104km2).
Table 4. Statistics on the global grassland improving areas in different climatic regions across continents (104km2).
Figure 4. Distribution of global grassland degrading areas in different degrees from 2000–2020 and hotspots locations: Southern Africa (region A); East African Plateau (region B); Northern Caspian Sea in Asia (region C); Eastern Brazilian plateau (region D); Northern Bolivia (region E).
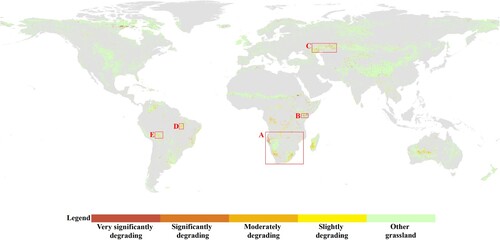
Figure 5. Distribution of global grassland improving areas in different degrees from 2000–2020 and hotspots locations: Qinghai-Tibet Plateau in China (region F); Loess Plateau (region G); Central North America (region H); Western Sahel in Africa (region I); Northern La Plata (region J).
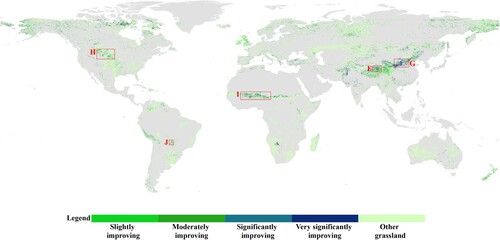
Figure 6. Global grassland degrading (a) and improving (b) to different degrees on each continent.
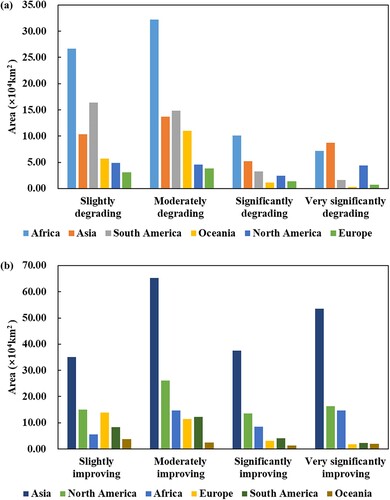
Figure 7. Global grassland degrading in different degrees across hotspots and remote sensing comparative images of random points in different periods.
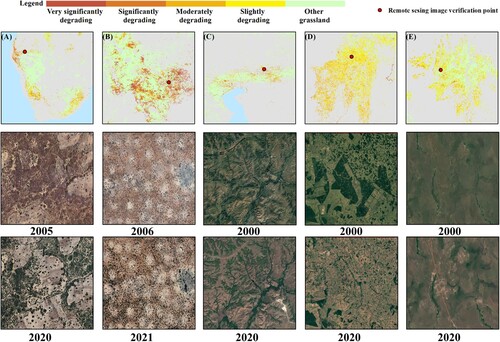
Figure 8. Global grassland improving in different degrees across hotspots and remote sensing comparative images of random points in different periods.
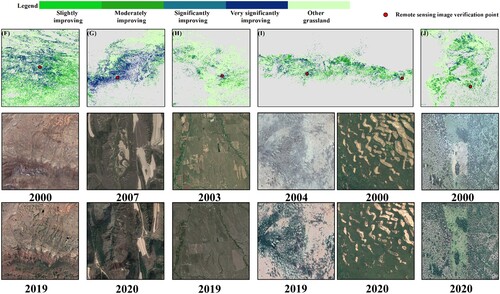
Figure 9. Global grassland degrading (a) and improving (b) proportion to different degrees in different climatic regions.
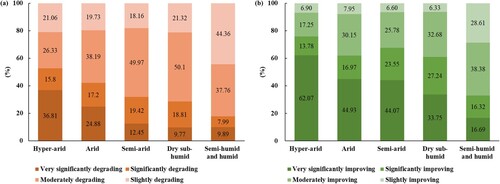
Figure 10. Distribution of global grassland degrading driving factors.
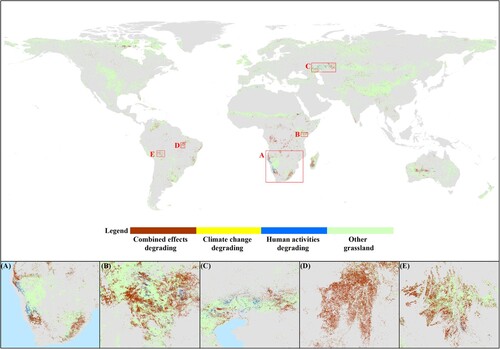
Figure 11. Distribution of global grassland improving driving factors.
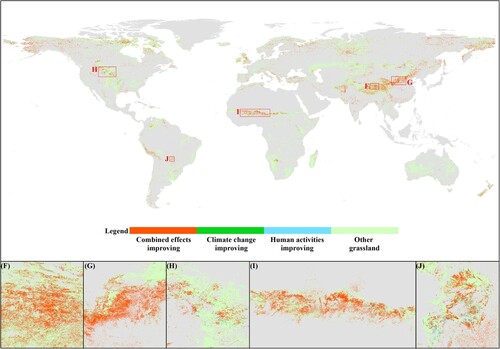
Table 5. Statistics on the global grassland degrading and improving driving factors areas and proportion.
Figure 12. Global grassland degrading (a) and improving (b) proportion of driving factors in different climatic regions.
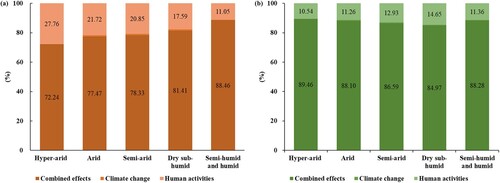
Figure 13. Distribution of global grassland degrading and improving MI trends in hotspots.
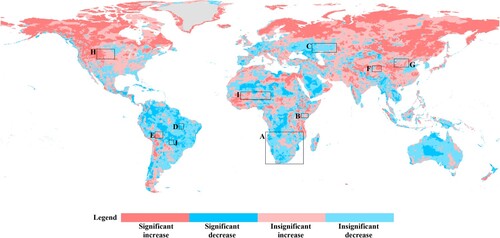
Figure 14. Precipitation and NPP variations in degrading grassland hotspots.
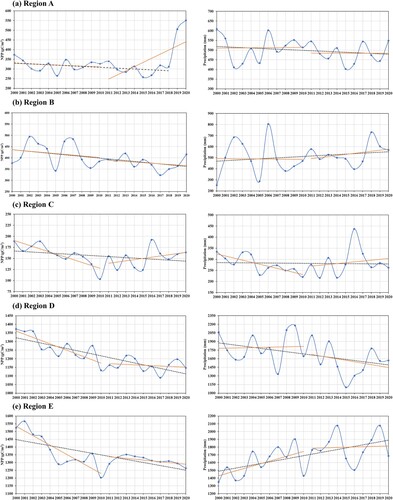
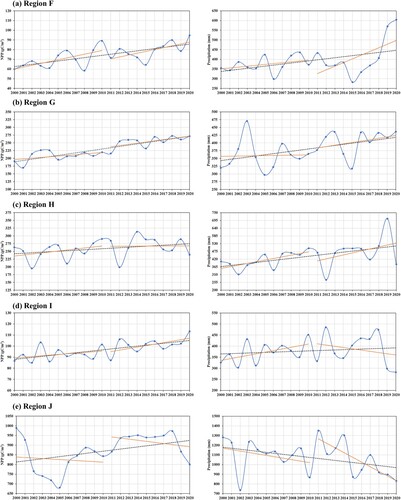
Figure 15. Precipitation and NPP variations in improving grassland hotspots.
Data availability statement
The data that support the findings of this study are available from the corresponding author, [Bin Sun], upon reasonable request.