
Figures & data
Figure 1. Positional relationships of the current and following control points, in addition to variables for advancement.
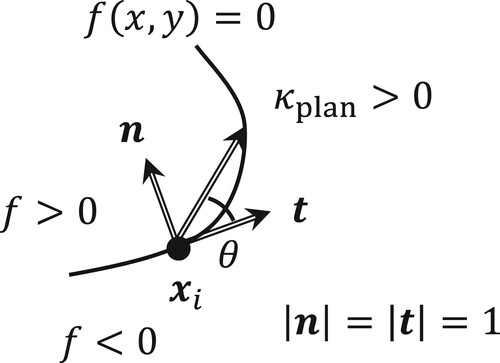
Figure 2. Difference between tangent angles estimated by two curvatures.
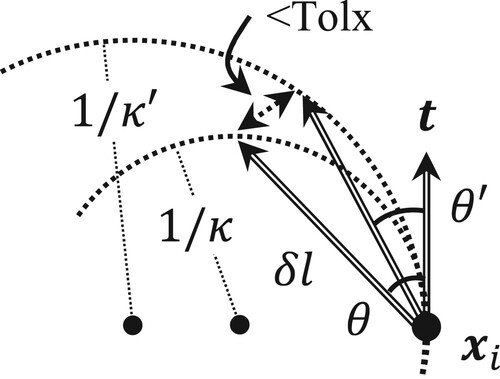
Figure 3. Gleaning points proximal to an arc portion.
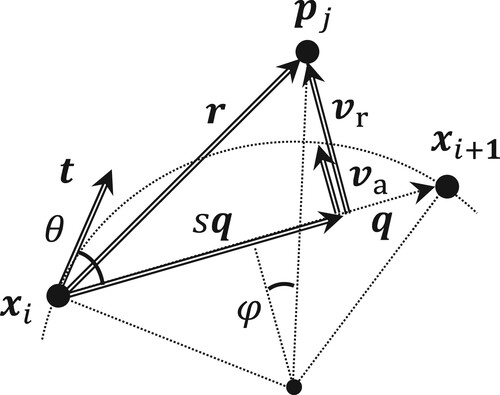
Figure 4. Existence of cubic function roots.
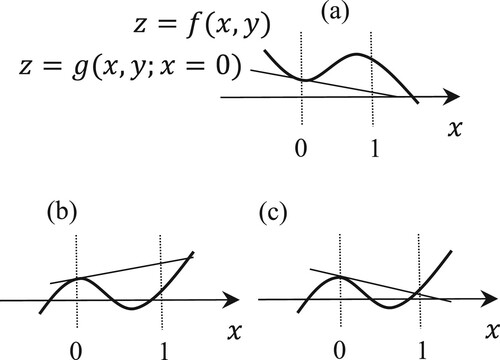
Figure 5. A small closure detected by the recursive disaggregation of patches.
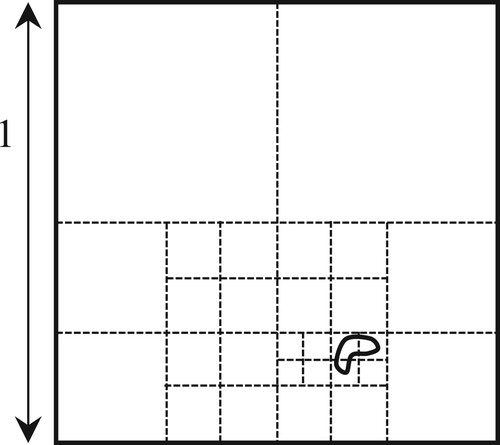
Figure 6. Proposed algorithm for identifying complete sets of contour objects.
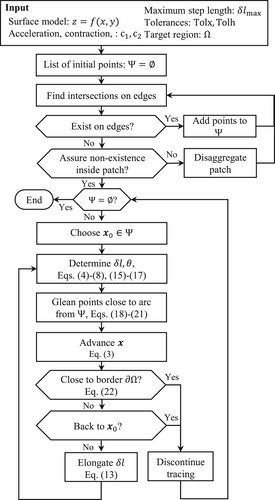
Figure 7. Location of Izu-Oshima island, Tokyo, Japan.
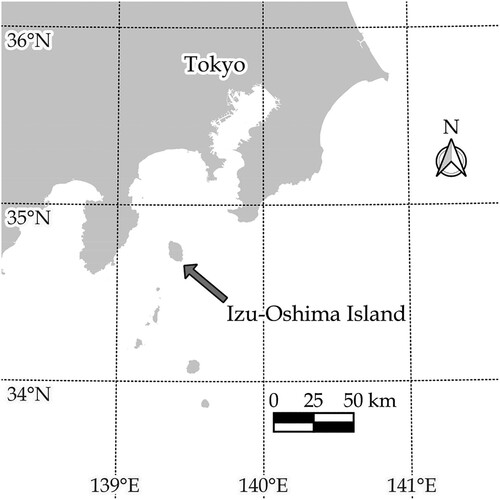
Figure 8. Contours identified using the proposed framework (Framework A).
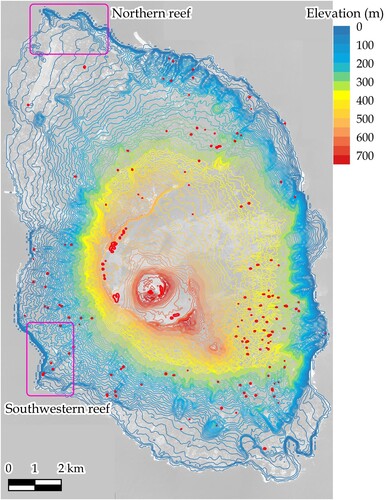
Figure 9. Contours identified using the method established by Goto and Shimakawa (Goto and Shimakawa Citation2016) (Framework B).
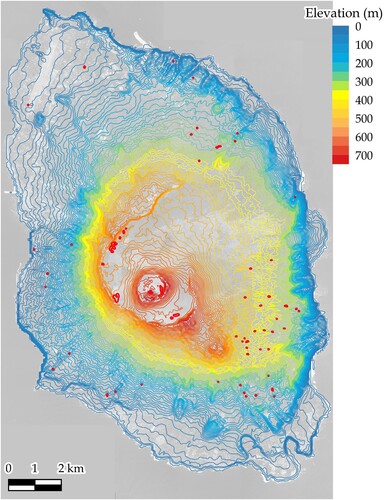
Table 1. Contour profiles identified using the three frameworks.
Table 2. Computation times with varying tolerances for patch disaggregation.
Figure 10. Identified contours around the northern reef using the four methods.
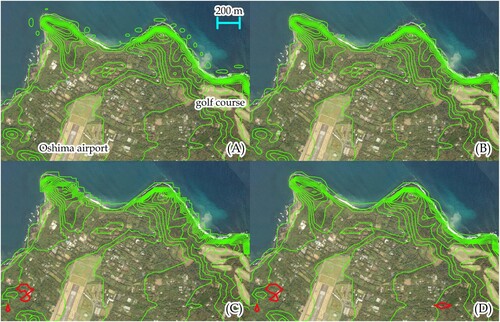
Figure 11. Identified contours around the southwestern reef using the four methods.
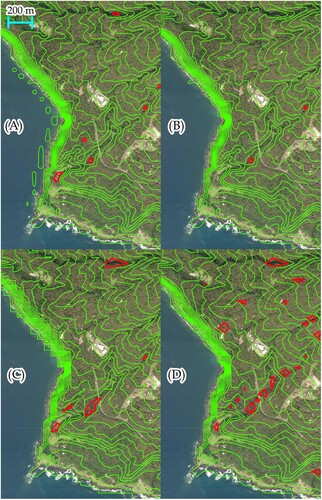
Figure 12. Overview of the three-dimensionally consistent contour-based network.
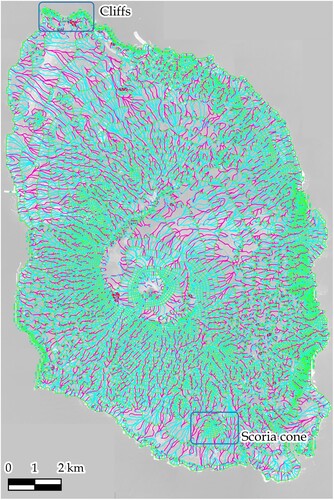
Figure 13. Detailed contour-based network around the cliffs and scoria cone.

Figure 14. Overview of the island based on the slope analysis.
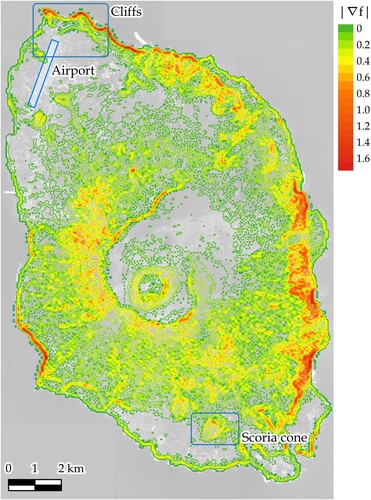
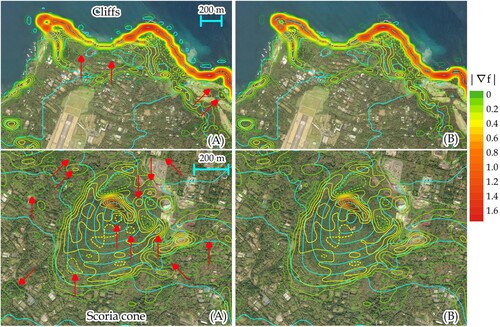
Figure 15. Detailed slope analysis around the cliffs and scoria cone.
Data availability statement
The datasets that support the findings of this study are openly available in ‘Mendeley Data' at http://dx.doi.org/10.17632/f4hfsfrsy4.1. All of them are preserved in the ESRI’s Shapefile format.