
Figures & data
Figure 1. Grids with different cell shape: (a) diamond; (b) triangle; (c) hexagon; (d) square.
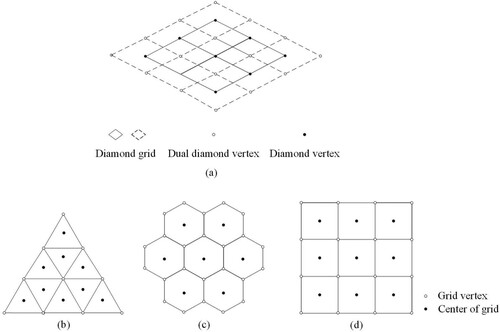
Figure 2. Flowchart of the quality evaluation indicator model. The abbreviations in Discrete Global Grid Systems are described in . The abbreviations among the Quantitative Indicators are defined in Appendix 1. DATA refers to an observation data matrix.
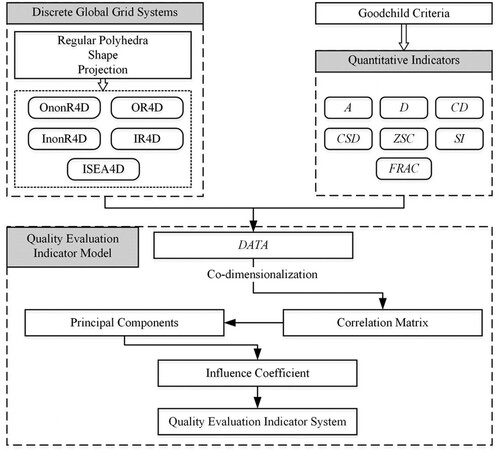
Figure 3. Regular polyhedrons: (a) octahedron; (b) spherical octahedron; (c) icosahedron.
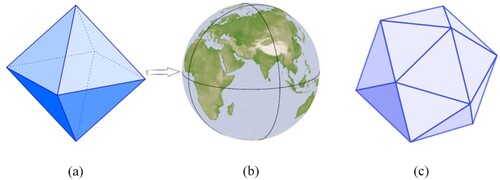
Figure 4. Diamond grids with different aperture: (a) aperture-4 diamond; (b) aperture-9 diamond.
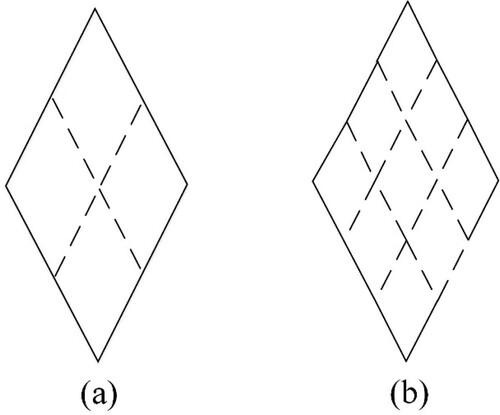
Table 1. Discrete global grid systems used this paper.
Figure 5. Spherical polygon P. Where O is the center of the sphere, p1, p2, p3, p4 are vertices of the spherical polygon P.
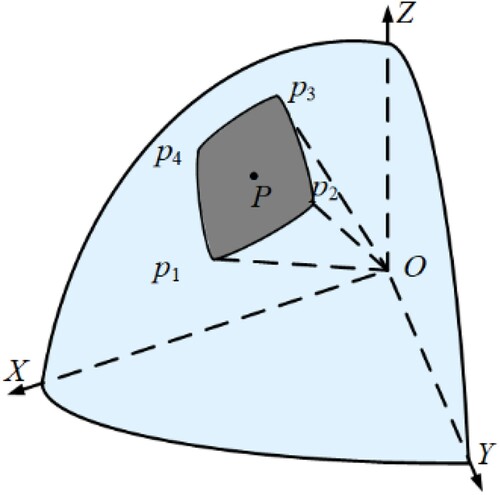
Figure 6. Polygon P and its dihedral angle. p1, p2, p3, p4 are the vertices of spherical polygon P; α1, α2, α3 and α4 are the inner angles of the spherical polygon P; is the normal vector of plane Op2p3.
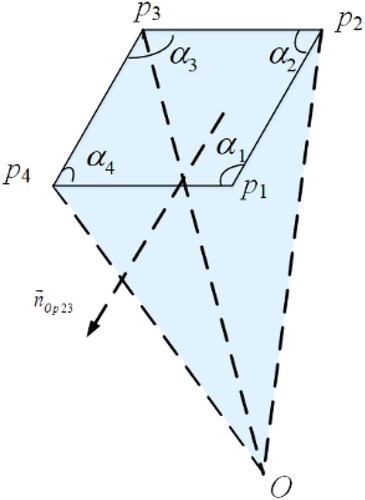
Figure 7. Spherical distance. Where O is the center of the sphere; r is the radius of the sphere; pi and pj are points on the sphere; θij is the angle between and
; dij is the spherical distance between pi and pj.
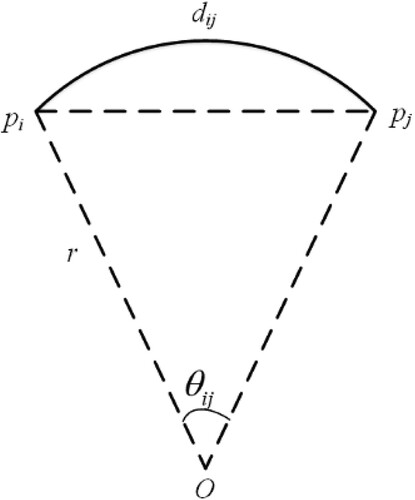
Figure 8. Distance between two adjacent grid cell centers. Where qP, qP1, qP2, qP3 and qP4 is the center of the diamond grid cell P, P1, P2, P3 and P4.
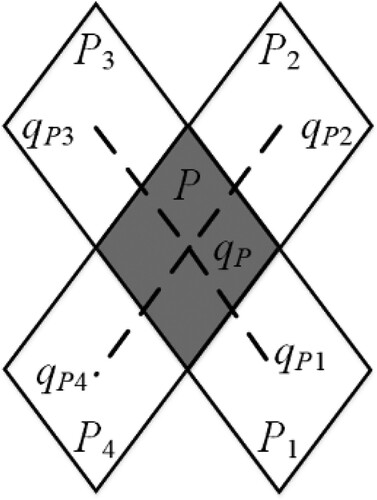
Figure 9. Parameters for CSD. Where qi and qj are the centers of grid cell Pi and Pj, respectively; pij is the shared edge between grid cell Pi and Pj; cpij is the midpoint of pij; qij is the line connecting grid centers qi and qj; cqij is the midpoint of qij; CSD is the geodesic distance between cpij and cqij.
Table 2. Statistics of indicators of OnonR4D-5 model (R = 6371.007 km).
Table 3. Correlation coefficient matrix of the OnonR4D-5 model.
Table 4. Eigenvalue and cumulative contribution rate of variance for the OnonR4D-5 model.
Figure 10. Curve of eigenvalues of the OnonR4D-5 model.
Table 5. Influence coefficient of the principal components of the OnonR4D-5 model.
Figure 11. Path diagrams of the OnonR4D-5 Model. The green and red arrow indicate the positive and negative, respectively, and the number on each of arrows represent the absolute value of the influence coefficients of the principal components of the OnonR4D-5 model (similarly hereinafter).
Table 6. Correlation matrix of the OR4D-5 model.
Table 7. Eigenvalue and cumulative contribution rate of variance for the OR4D-5 model.
Table 8. Influence coefficients of the principal components of the OR4D-5 model.
Figure 12. Path diagram of the OR4D-5 model.
Table 9. Correlation matrix of the InonR4D-5 model.
Table 10. Eigenvalue and cumulative contribution rate of variance for the InonR4D-5 model.
Figure 13. Path diagrams of the InonR4D-5 model.
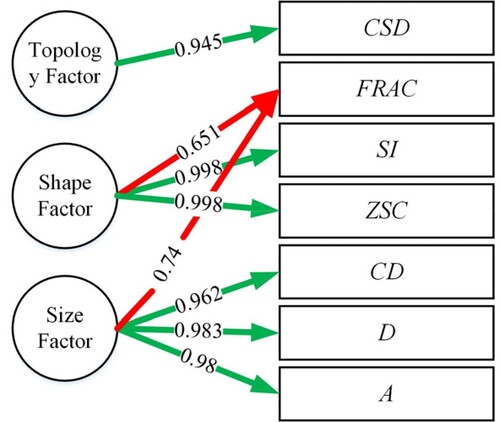
Table 11. Influence coefficients of the principal components of the InonR4D-5 model.
Table 12. Correlation matrix of the IR4D-5 model.
Table 13. Eigenvalue and cumulative contribution rate of the variance for the IR4D-5 model.
Table 14. Influence coefficients of the principal components of the IR4D-5 model.
Figure 14. Path diagrams of the IR4D-5 model.
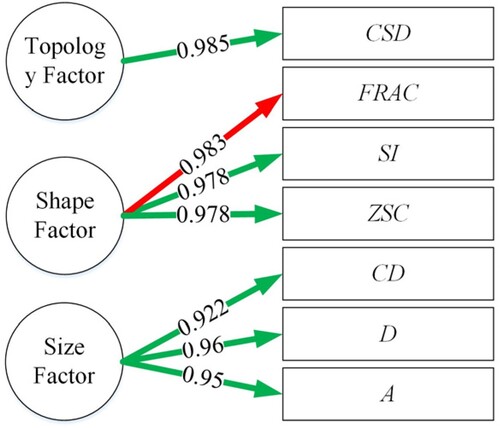
Table 15. Statistics of indicators for the ISEA4D-5 model (R = 6371.007 km).
Figure 15. Curve of eigenvalues for the ISEA4D-5 model.
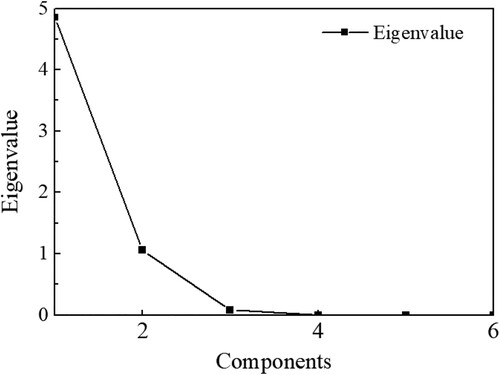
Table 16. Correlation matrix of the ISEA4D-5 model.
Table 17. Eigenvalue and cumulative contribution rate of the variance for the ISEA4D-5 model.
Table 18. Influence coefficients of the principal components for the ISEA4D-5 model.
Figure 16. Path diagrams of the ISEA4D-5 model.
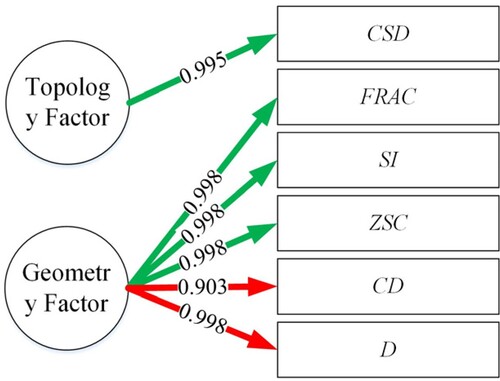
Table A1. The Goodchild criteria.
Table A2. Influence coefficients of the principal components of the OnonR4D-6 model.
Table A3. Influence coefficients of the principal components of the OnonR4D-7 model.
Table A4. Influence coefficients of the principal components of the OnonR4D-8 model.
Table A5. Influence coefficients of the principal components of the OR4D-6 model.
Table A6. Influence coefficients of the principal components of the OR4D-7 model.
Table A7. Influence coefficients of the principal components of the OR4D-8 model.
Table A8. Influence coefficients of the principal components of the InonR4D-6 model.
Table A9. Influence coefficients of the principal components of the InonR4D-7 model.
Table A10. Influence coefficients of the principal components of the InonR4D-8 model.
Table A11. Influence coefficients of the principal components of the IR4D-6 model.
Table A12. Influence coefficients of the principal components of the IR4D-7 model.
Table A13. Influence coefficients of the principal components of the IR4D-8 model.
Table A14. Influence coefficients of the principal components of the ISEA4D-6 model.
Table A15. Influence coefficients of the principal components of the ISEA4D-7 model.
Table A16. Influence coefficients of the principal components of the ISEA4D-8 model.
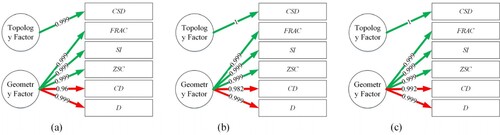
Figure A1. Path diagrams of the OnonR4D Model: (a) OnonR4D-6; (b) OnonR4D-7; (c) OnonR4D-8. The green and red arrow indicate the positive and negative, respectively, and the number on each of arrows represent the absolute value of the influence coefficients of the principal components of the OnonR4D-6/7/8 model (similarly hereinafter).
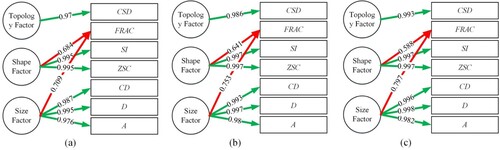
Figure A2. Path diagrams of the OR4D Model: (a) OR4D-6; (b) OR4D-7; (c) OR4D-8.
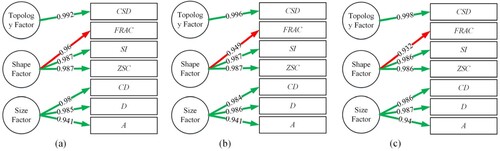
Figure A3. Path diagrams of the InonR4D Model: (a) InonR4D-6; (b) InonR4D-7; (c) InonR4D-8.
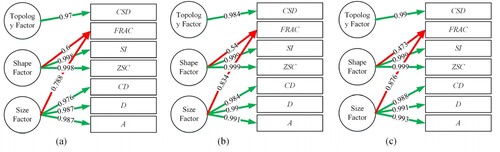
Figure A4. Path diagrams of the IR4D Model: (a) IR4D-6; (b) IR4D-7; (c) IR4D-8.
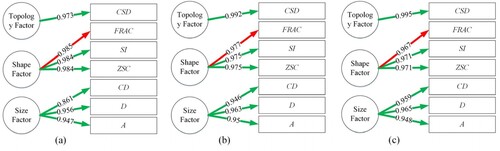
Figure A5. Path diagrams of the ISEA4D Model: (a) ISEA4D-6; (b) ISEA4D-7; (c) ISEA4D-8.
Data availability statement
All grids in this study are generated by the open-source DGGS implementation – DGGRID, which can be retrieved from https://www.discreteglobalgrids.org/software/. And the original data for five grids can be obtained from https://github.com/joelfl/Data-for-Quality-Evaluation-Indicator-System-.git.