
Figures & data
Table 1. Data Sources for each section.
Figure 1. Technical route (the model classifier train is a reused part.).
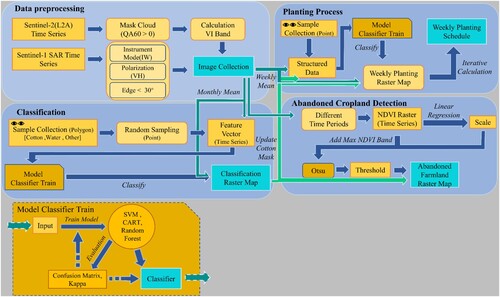
Figure 2. Overview of the study area and distribution of some samples.
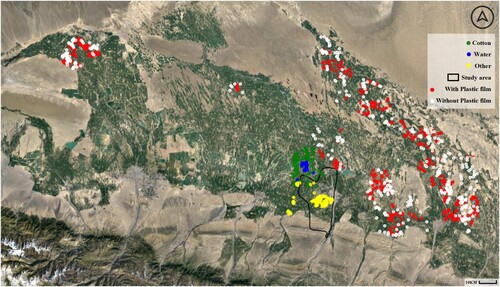
Figure 3. Data set area distribution.
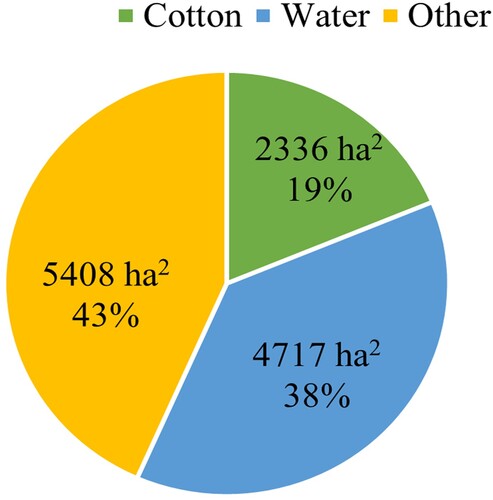
Figure 4. Example of the image covered by plastic film on May 6, 2021.
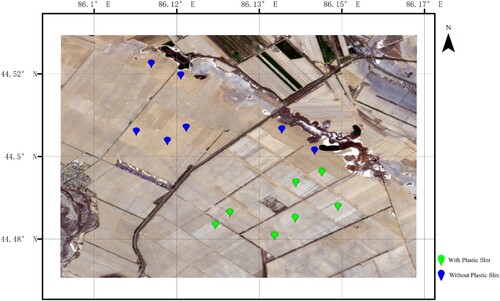
Figure 5 Prediction result combination diagrams.
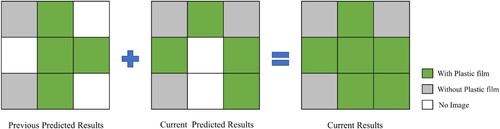
Figure 6. Monthly changes in different categories.
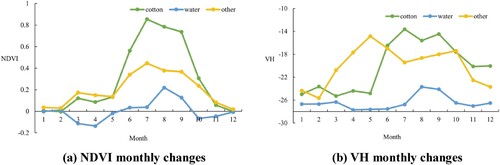
Table 2. Model verification results for classification.
Figure 7. Detailed display of classification results.
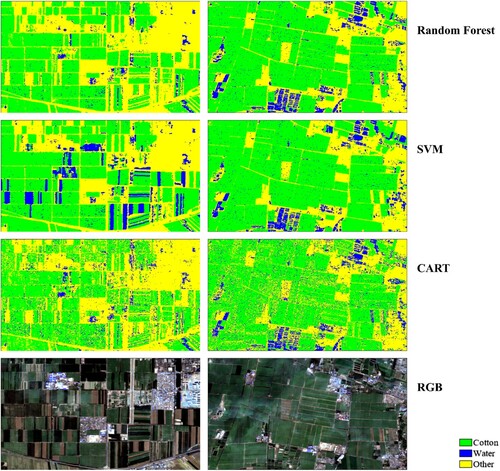
Table 3. Model verification results for the cultivation process.
Figure 8. Cultivation progress at different times based on different models.
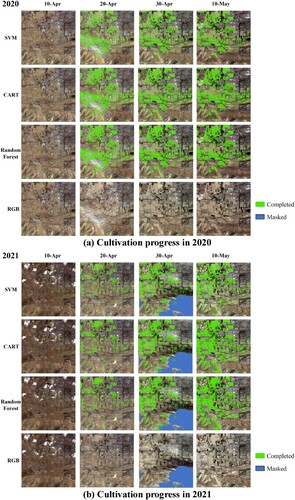
Table 4. Cultivation progress monitored by different models.
Figure 9. Statistics of cultivation progress monitored by each model.
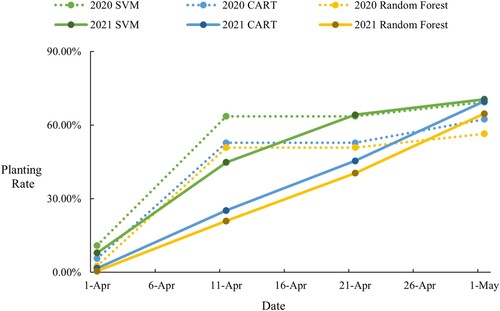
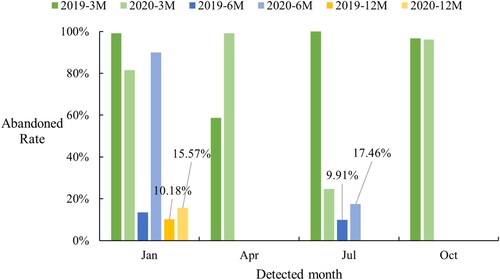
Figure 10. Changes in the detection results of abandoned cropland.
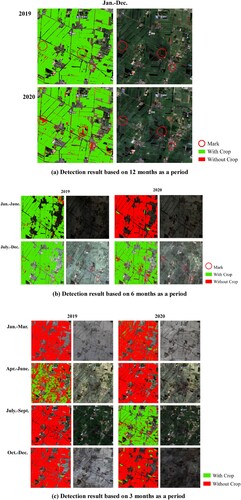
Figure 11. Statistics of abandoned cropland detection results.
Data availability
Data available on request from the authors.